Immigrants from Italy vs Bahamian Disability
COMPARE
Immigrants from Italy
Bahamian
Disability
Disability Comparison
Immigrants from Italy
Bahamians
11.4%
DISABILITY
90.4/ 100
METRIC RATING
127th/ 347
METRIC RANK
12.2%
DISABILITY
2.3/ 100
METRIC RATING
233rd/ 347
METRIC RANK
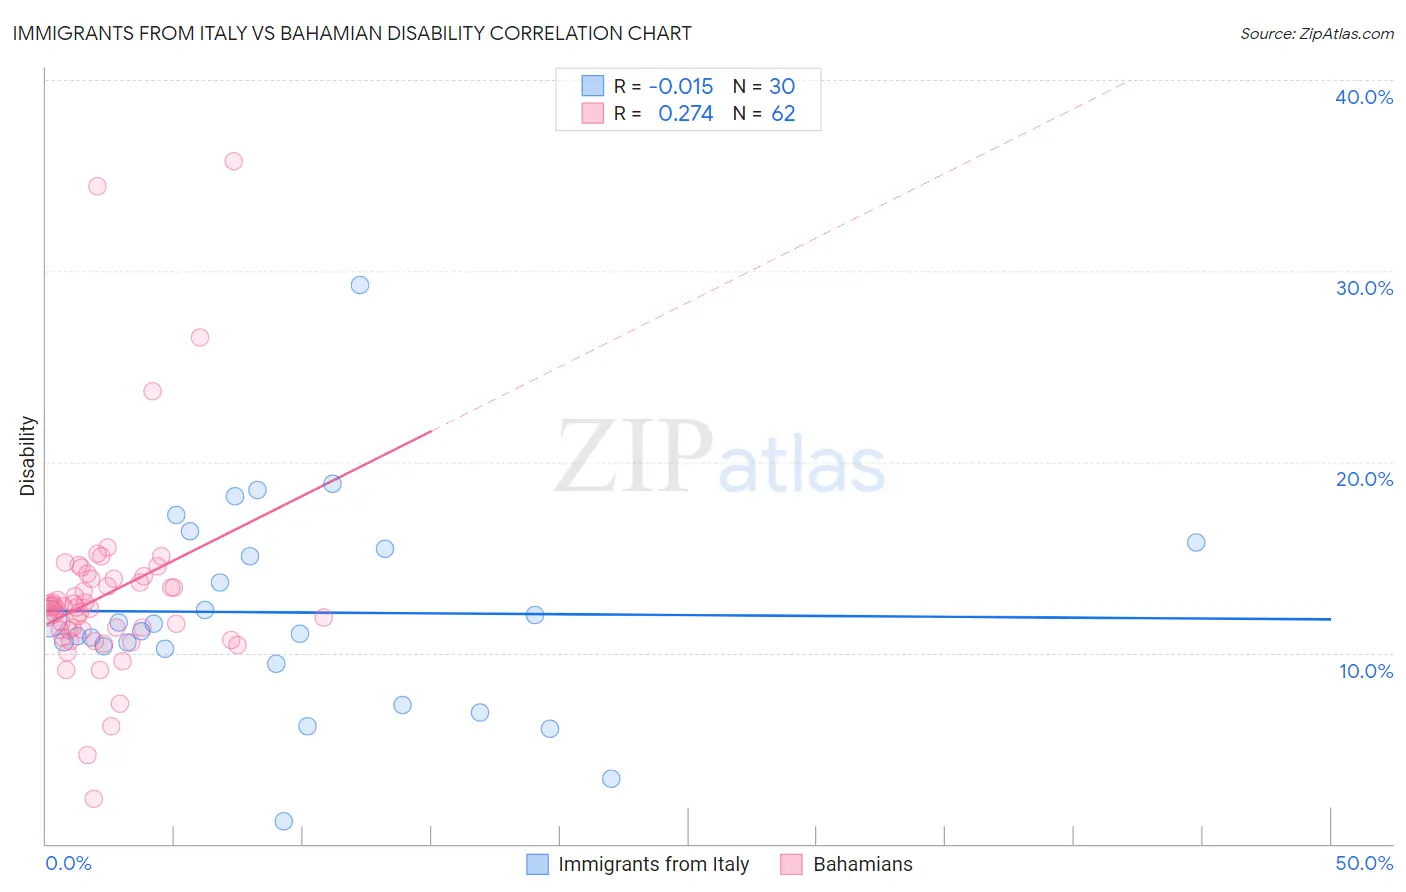
Immigrants from Italy vs Bahamian Disability Correlation Chart
The statistical analysis conducted on geographies consisting of 324,217,000 people shows no correlation between the proportion of Immigrants from Italy and percentage of population with a disability in the United States with a correlation coefficient (R) of -0.015 and weighted average of 11.4%. Similarly, the statistical analysis conducted on geographies consisting of 112,688,060 people shows a weak positive correlation between the proportion of Bahamians and percentage of population with a disability in the United States with a correlation coefficient (R) of 0.274 and weighted average of 12.2%, a difference of 6.8%.
Disability Correlation Summary
| Measurement | Immigrants from Italy | Bahamian |
| Minimum | 1.2% | 2.3% |
| Maximum | 29.3% | 35.8% |
| Range | 28.1% | 33.4% |
| Mean | 12.1% | 13.0% |
| Median | 11.3% | 12.4% |
| Interquartile 25% (IQ1) | 10.2% | 11.2% |
| Interquartile 75% (IQ3) | 15.4% | 13.9% |
| Interquartile Range (IQR) | 5.2% | 2.7% |
| Standard Deviation (Sample) | 5.4% | 5.3% |
| Standard Deviation (Population) | 5.3% | 5.2% |
Similar Demographics by Disability
Demographics Similar to Immigrants from Italy by Disability
In terms of disability, the demographic groups most similar to Immigrants from Italy are Immigrants from Europe (11.4%, a difference of 0.0%), Macedonian (11.4%, a difference of 0.020%), Immigrants from Latvia (11.4%, a difference of 0.070%), Latvian (11.4%, a difference of 0.070%), and Immigrants from Croatia (11.4%, a difference of 0.080%).
| Demographics | Rating | Rank | Disability |
| Immigrants | North Macedonia | 93.5 /100 | #120 | Exceptional 11.4% |
| Immigrants | Costa Rica | 93.4 /100 | #121 | Exceptional 11.4% |
| Brazilians | 93.3 /100 | #122 | Exceptional 11.4% |
| South Africans | 92.3 /100 | #123 | Exceptional 11.4% |
| South American Indians | 92.2 /100 | #124 | Exceptional 11.4% |
| Costa Ricans | 91.9 /100 | #125 | Exceptional 11.4% |
| Immigrants | Latvia | 90.9 /100 | #126 | Exceptional 11.4% |
| Immigrants | Italy | 90.4 /100 | #127 | Exceptional 11.4% |
| Immigrants | Europe | 90.4 /100 | #128 | Exceptional 11.4% |
| Macedonians | 90.3 /100 | #129 | Exceptional 11.4% |
| Latvians | 89.8 /100 | #130 | Excellent 11.4% |
| Immigrants | Croatia | 89.8 /100 | #131 | Excellent 11.4% |
| Immigrants | Africa | 89.3 /100 | #132 | Excellent 11.4% |
| Arabs | 89.1 /100 | #133 | Excellent 11.4% |
| Immigrants | Guyana | 88.3 /100 | #134 | Excellent 11.4% |
Demographics Similar to Bahamians by Disability
In terms of disability, the demographic groups most similar to Bahamians are Japanese (12.2%, a difference of 0.030%), Yup'ik (12.2%, a difference of 0.070%), Italian (12.2%, a difference of 0.090%), Malaysian (12.2%, a difference of 0.10%), and Samoan (12.2%, a difference of 0.13%).
| Demographics | Rating | Rank | Disability |
| Jamaicans | 3.3 /100 | #226 | Tragic 12.1% |
| Alsatians | 3.3 /100 | #227 | Tragic 12.1% |
| West Indians | 2.9 /100 | #228 | Tragic 12.2% |
| Inupiat | 2.8 /100 | #229 | Tragic 12.2% |
| Samoans | 2.6 /100 | #230 | Tragic 12.2% |
| Malaysians | 2.5 /100 | #231 | Tragic 12.2% |
| Italians | 2.5 /100 | #232 | Tragic 12.2% |
| Bahamians | 2.3 /100 | #233 | Tragic 12.2% |
| Japanese | 2.3 /100 | #234 | Tragic 12.2% |
| Yup'ik | 2.2 /100 | #235 | Tragic 12.2% |
| Chinese | 2.0 /100 | #236 | Tragic 12.2% |
| Immigrants | Congo | 1.9 /100 | #237 | Tragic 12.2% |
| Norwegians | 1.9 /100 | #238 | Tragic 12.2% |
| Swedes | 1.8 /100 | #239 | Tragic 12.2% |
| Hungarians | 1.7 /100 | #240 | Tragic 12.2% |