Immigrants from Uganda vs Costa Rican Disability
COMPARE
Immigrants from Uganda
Costa Rican
Disability
Disability Comparison
Immigrants from Uganda
Costa Ricans
11.3%
DISABILITY
95.7/ 100
METRIC RATING
109th/ 347
METRIC RANK
11.4%
DISABILITY
91.9/ 100
METRIC RATING
125th/ 347
METRIC RANK
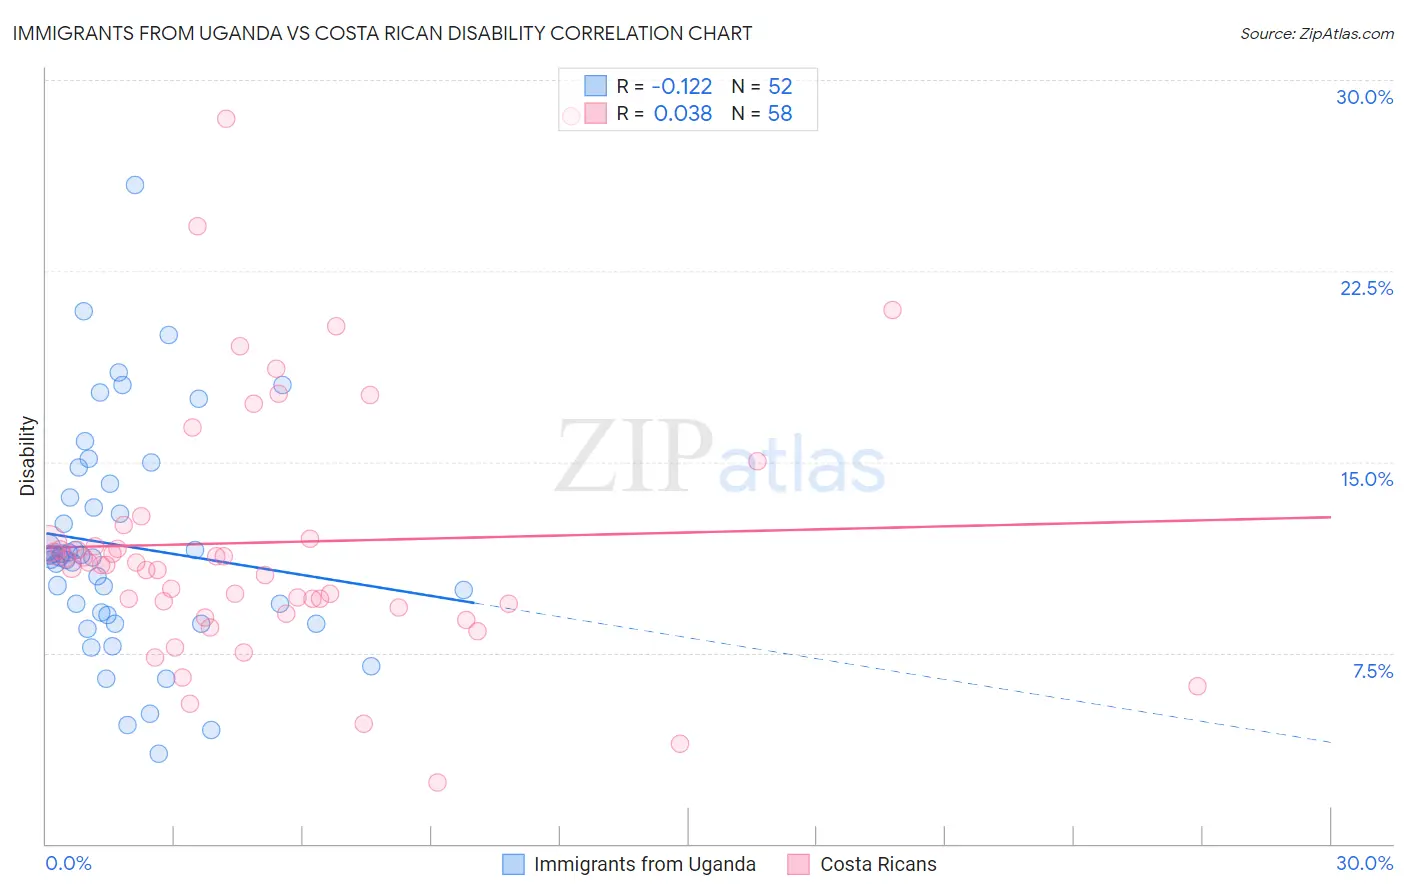
Immigrants from Uganda vs Costa Rican Disability Correlation Chart
The statistical analysis conducted on geographies consisting of 125,981,344 people shows a poor negative correlation between the proportion of Immigrants from Uganda and percentage of population with a disability in the United States with a correlation coefficient (R) of -0.122 and weighted average of 11.3%. Similarly, the statistical analysis conducted on geographies consisting of 253,574,017 people shows no correlation between the proportion of Costa Ricans and percentage of population with a disability in the United States with a correlation coefficient (R) of 0.038 and weighted average of 11.4%, a difference of 0.77%.
Disability Correlation Summary
| Measurement | Immigrants from Uganda | Costa Rican |
| Minimum | 3.5% | 2.4% |
| Maximum | 25.9% | 28.6% |
| Range | 22.4% | 26.2% |
| Mean | 11.7% | 11.8% |
| Median | 11.3% | 10.9% |
| Interquartile 25% (IQ1) | 8.8% | 9.3% |
| Interquartile 75% (IQ3) | 13.9% | 12.0% |
| Interquartile Range (IQR) | 5.1% | 2.7% |
| Standard Deviation (Sample) | 4.4% | 5.2% |
| Standard Deviation (Population) | 4.4% | 5.2% |
Demographics Similar to Immigrants from Uganda and Costa Ricans by Disability
In terms of disability, the demographic groups most similar to Immigrants from Uganda are Immigrants from Denmark (11.3%, a difference of 0.020%), Immigrants from Nigeria (11.3%, a difference of 0.080%), Immigrants from South Eastern Asia (11.3%, a difference of 0.080%), Nicaraguan (11.3%, a difference of 0.16%), and Immigrants from Uzbekistan (11.3%, a difference of 0.20%). Similarly, the demographic groups most similar to Costa Ricans are South American Indian (11.4%, a difference of 0.040%), South African (11.4%, a difference of 0.060%), Immigrants from Latvia (11.4%, a difference of 0.15%), Immigrants from Italy (11.4%, a difference of 0.22%), and Brazilian (11.4%, a difference of 0.23%).
| Demographics | Rating | Rank | Disability |
| Nicaraguans | 96.2 /100 | #107 | Exceptional 11.3% |
| Immigrants | Nigeria | 96.0 /100 | #108 | Exceptional 11.3% |
| Immigrants | Uganda | 95.7 /100 | #109 | Exceptional 11.3% |
| Immigrants | Denmark | 95.6 /100 | #110 | Exceptional 11.3% |
| Immigrants | South Eastern Asia | 95.4 /100 | #111 | Exceptional 11.3% |
| Immigrants | Uzbekistan | 94.9 /100 | #112 | Exceptional 11.3% |
| Guyanese | 94.7 /100 | #113 | Exceptional 11.3% |
| Immigrants | Syria | 94.7 /100 | #114 | Exceptional 11.3% |
| Immigrants | Philippines | 94.6 /100 | #115 | Exceptional 11.3% |
| Immigrants | Northern Europe | 94.1 /100 | #116 | Exceptional 11.3% |
| Luxembourgers | 93.9 /100 | #117 | Exceptional 11.3% |
| Koreans | 93.8 /100 | #118 | Exceptional 11.3% |
| Central Americans | 93.5 /100 | #119 | Exceptional 11.4% |
| Immigrants | North Macedonia | 93.5 /100 | #120 | Exceptional 11.4% |
| Immigrants | Costa Rica | 93.4 /100 | #121 | Exceptional 11.4% |
| Brazilians | 93.3 /100 | #122 | Exceptional 11.4% |
| South Africans | 92.3 /100 | #123 | Exceptional 11.4% |
| South American Indians | 92.2 /100 | #124 | Exceptional 11.4% |
| Costa Ricans | 91.9 /100 | #125 | Exceptional 11.4% |
| Immigrants | Latvia | 90.9 /100 | #126 | Exceptional 11.4% |
| Immigrants | Italy | 90.4 /100 | #127 | Exceptional 11.4% |