Immigrants from Uganda vs Taiwanese Disability
COMPARE
Immigrants from Uganda
Taiwanese
Disability
Disability Comparison
Immigrants from Uganda
Taiwanese
11.3%
DISABILITY
95.7/ 100
METRIC RATING
109th/ 347
METRIC RANK
10.8%
DISABILITY
99.9/ 100
METRIC RATING
47th/ 347
METRIC RANK
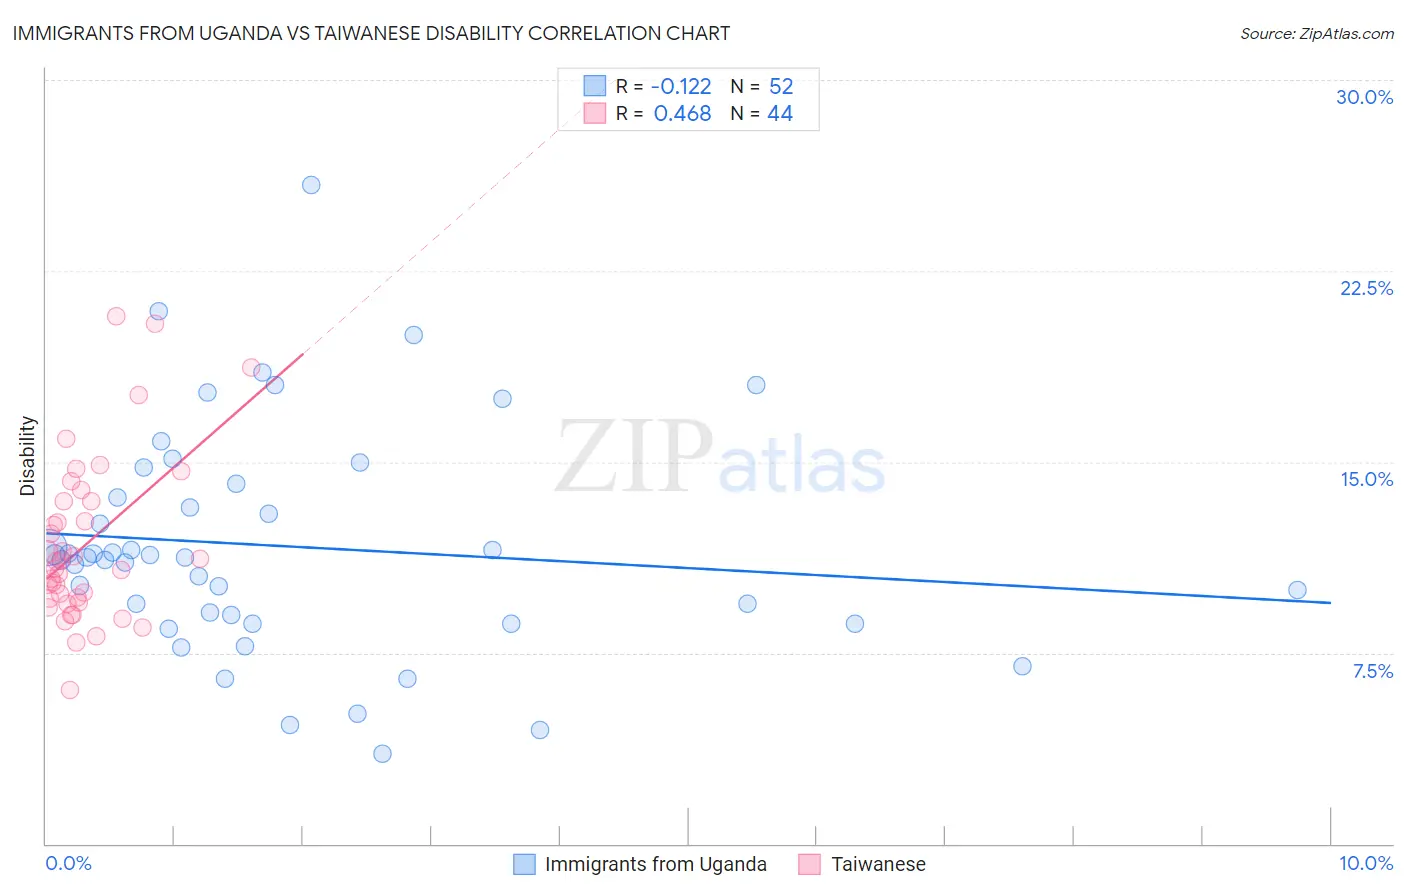
Immigrants from Uganda vs Taiwanese Disability Correlation Chart
The statistical analysis conducted on geographies consisting of 125,981,344 people shows a poor negative correlation between the proportion of Immigrants from Uganda and percentage of population with a disability in the United States with a correlation coefficient (R) of -0.122 and weighted average of 11.3%. Similarly, the statistical analysis conducted on geographies consisting of 31,724,936 people shows a moderate positive correlation between the proportion of Taiwanese and percentage of population with a disability in the United States with a correlation coefficient (R) of 0.468 and weighted average of 10.8%, a difference of 4.3%.
Disability Correlation Summary
| Measurement | Immigrants from Uganda | Taiwanese |
| Minimum | 3.5% | 6.1% |
| Maximum | 25.9% | 20.7% |
| Range | 22.4% | 14.7% |
| Mean | 11.7% | 11.7% |
| Median | 11.3% | 11.0% |
| Interquartile 25% (IQ1) | 8.8% | 9.6% |
| Interquartile 75% (IQ3) | 13.9% | 13.4% |
| Interquartile Range (IQR) | 5.1% | 3.9% |
| Standard Deviation (Sample) | 4.4% | 3.2% |
| Standard Deviation (Population) | 4.4% | 3.2% |
Similar Demographics by Disability
Demographics Similar to Immigrants from Uganda by Disability
In terms of disability, the demographic groups most similar to Immigrants from Uganda are Immigrants from Denmark (11.3%, a difference of 0.020%), Immigrants from Nigeria (11.3%, a difference of 0.080%), Immigrants from South Eastern Asia (11.3%, a difference of 0.080%), Nicaraguan (11.3%, a difference of 0.16%), and Immigrants from Eastern Europe (11.3%, a difference of 0.18%).
| Demographics | Rating | Rank | Disability |
| Immigrants | Eastern Africa | 96.7 /100 | #102 | Exceptional 11.3% |
| Immigrants | Uruguay | 96.4 /100 | #103 | Exceptional 11.3% |
| Immigrants | Immigrants | 96.4 /100 | #104 | Exceptional 11.3% |
| Immigrants | Kazakhstan | 96.4 /100 | #105 | Exceptional 11.3% |
| Immigrants | Eastern Europe | 96.3 /100 | #106 | Exceptional 11.3% |
| Nicaraguans | 96.2 /100 | #107 | Exceptional 11.3% |
| Immigrants | Nigeria | 96.0 /100 | #108 | Exceptional 11.3% |
| Immigrants | Uganda | 95.7 /100 | #109 | Exceptional 11.3% |
| Immigrants | Denmark | 95.6 /100 | #110 | Exceptional 11.3% |
| Immigrants | South Eastern Asia | 95.4 /100 | #111 | Exceptional 11.3% |
| Immigrants | Uzbekistan | 94.9 /100 | #112 | Exceptional 11.3% |
| Guyanese | 94.7 /100 | #113 | Exceptional 11.3% |
| Immigrants | Syria | 94.7 /100 | #114 | Exceptional 11.3% |
| Immigrants | Philippines | 94.6 /100 | #115 | Exceptional 11.3% |
| Immigrants | Northern Europe | 94.1 /100 | #116 | Exceptional 11.3% |
Demographics Similar to Taiwanese by Disability
In terms of disability, the demographic groups most similar to Taiwanese are Tongan (10.8%, a difference of 0.010%), Immigrants from Peru (10.8%, a difference of 0.020%), Soviet Union (10.9%, a difference of 0.19%), Vietnamese (10.9%, a difference of 0.25%), and Immigrants from Saudi Arabia (10.9%, a difference of 0.25%).
| Demographics | Rating | Rank | Disability |
| Mongolians | 99.9 /100 | #40 | Exceptional 10.8% |
| Immigrants | Australia | 99.9 /100 | #41 | Exceptional 10.8% |
| Immigrants | Nepal | 99.9 /100 | #42 | Exceptional 10.8% |
| Israelis | 99.9 /100 | #43 | Exceptional 10.8% |
| Immigrants | Japan | 99.9 /100 | #44 | Exceptional 10.8% |
| Immigrants | Peru | 99.9 /100 | #45 | Exceptional 10.8% |
| Tongans | 99.9 /100 | #46 | Exceptional 10.8% |
| Taiwanese | 99.9 /100 | #47 | Exceptional 10.8% |
| Soviet Union | 99.9 /100 | #48 | Exceptional 10.9% |
| Vietnamese | 99.9 /100 | #49 | Exceptional 10.9% |
| Immigrants | Saudi Arabia | 99.9 /100 | #50 | Exceptional 10.9% |
| Peruvians | 99.8 /100 | #51 | Exceptional 10.9% |
| South Americans | 99.8 /100 | #52 | Exceptional 10.9% |
| Immigrants | Spain | 99.8 /100 | #53 | Exceptional 10.9% |
| Jordanians | 99.8 /100 | #54 | Exceptional 10.9% |