Immigrants from Uganda vs Immigrants from Hungary Unemployment Among Ages 45 to 54 years
COMPARE
Immigrants from Uganda
Immigrants from Hungary
Unemployment Among Ages 45 to 54 years
Unemployment Among Ages 45 to 54 years Comparison
Immigrants from Uganda
Immigrants from Hungary
4.7%
UNEMPLOYMENT AMONG AGES 45 TO 54 YEARS
7.1/ 100
METRIC RATING
218th/ 347
METRIC RANK
4.5%
UNEMPLOYMENT AMONG AGES 45 TO 54 YEARS
50.0/ 100
METRIC RATING
174th/ 347
METRIC RANK
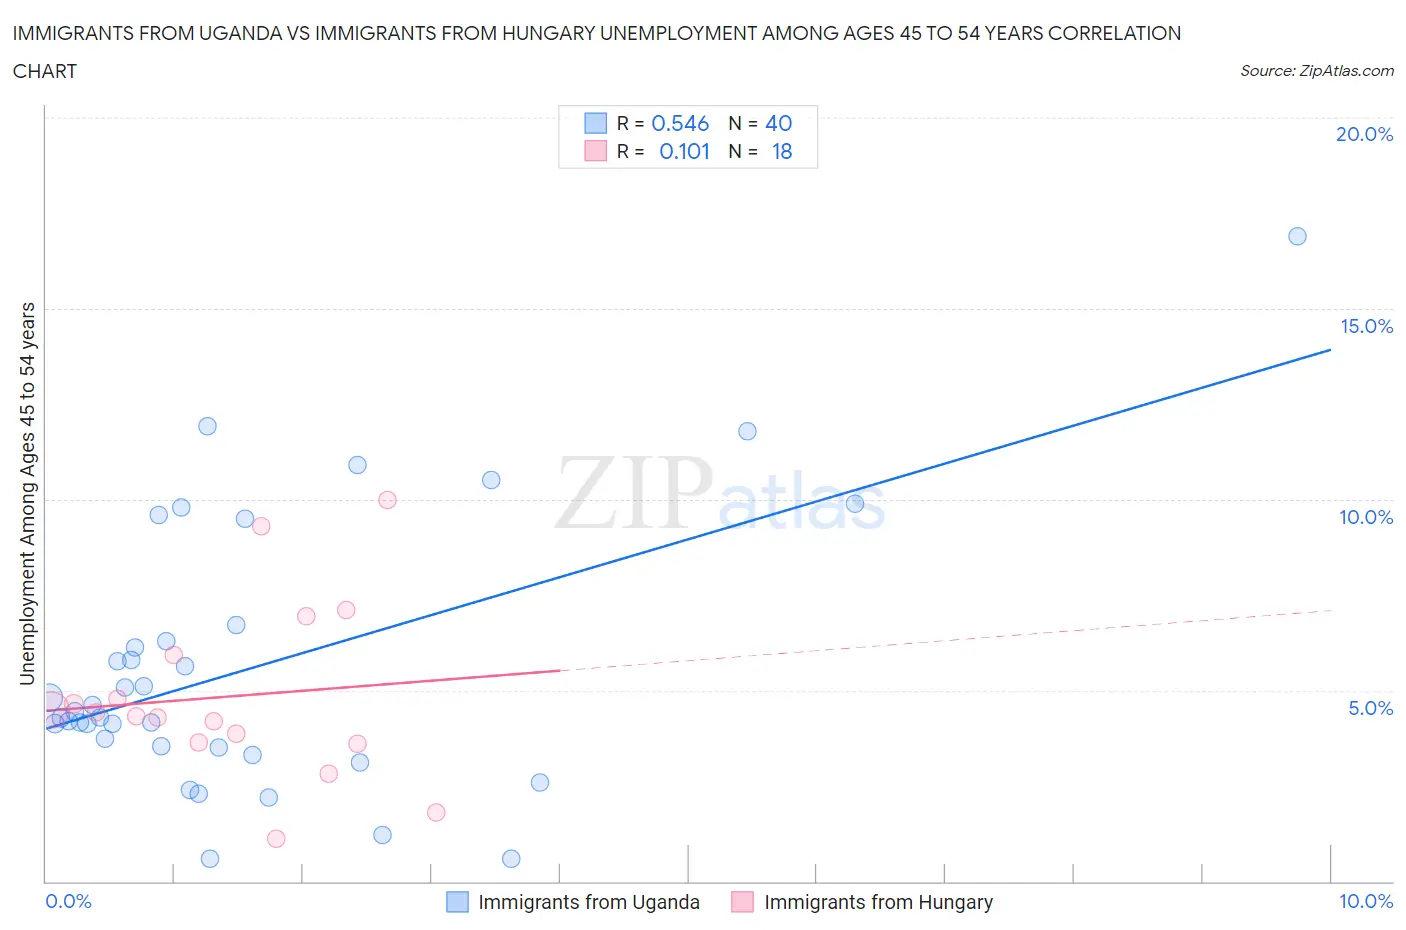
Immigrants from Uganda vs Immigrants from Hungary Unemployment Among Ages 45 to 54 years Correlation Chart
The statistical analysis conducted on geographies consisting of 125,210,317 people shows a substantial positive correlation between the proportion of Immigrants from Uganda and unemployment rate among population between the ages 45 and 54 in the United States with a correlation coefficient (R) of 0.546 and weighted average of 4.7%. Similarly, the statistical analysis conducted on geographies consisting of 193,618,917 people shows a poor positive correlation between the proportion of Immigrants from Hungary and unemployment rate among population between the ages 45 and 54 in the United States with a correlation coefficient (R) of 0.101 and weighted average of 4.5%, a difference of 3.0%.
Unemployment Among Ages 45 to 54 years Correlation Summary
| Measurement | Immigrants from Uganda | Immigrants from Hungary |
| Minimum | 0.60% | 1.1% |
| Maximum | 16.9% | 10.0% |
| Range | 16.3% | 8.9% |
| Mean | 5.6% | 4.8% |
| Median | 4.4% | 4.4% |
| Interquartile 25% (IQ1) | 3.5% | 3.6% |
| Interquartile 75% (IQ3) | 6.5% | 5.9% |
| Interquartile Range (IQR) | 3.0% | 2.3% |
| Standard Deviation (Sample) | 3.5% | 2.3% |
| Standard Deviation (Population) | 3.5% | 2.2% |
Similar Demographics by Unemployment Among Ages 45 to 54 years
Demographics Similar to Immigrants from Uganda by Unemployment Among Ages 45 to 54 years
In terms of unemployment among ages 45 to 54 years, the demographic groups most similar to Immigrants from Uganda are Nigerian (4.7%, a difference of 0.030%), Immigrants from Cambodia (4.7%, a difference of 0.050%), Guamanian/Chamorro (4.7%, a difference of 0.060%), Choctaw (4.7%, a difference of 0.18%), and Immigrants from Southern Europe (4.7%, a difference of 0.22%).
| Demographics | Rating | Rank | Unemployment Among Ages 45 to 54 years |
| Creek | 11.9 /100 | #211 | Poor 4.6% |
| Immigrants | Iran | 11.5 /100 | #212 | Poor 4.6% |
| Panamanians | 10.7 /100 | #213 | Poor 4.6% |
| Cherokee | 10.6 /100 | #214 | Poor 4.6% |
| Immigrants | Panama | 10.4 /100 | #215 | Poor 4.6% |
| Lumbee | 9.2 /100 | #216 | Tragic 4.6% |
| Immigrants | Cambodia | 7.4 /100 | #217 | Tragic 4.7% |
| Immigrants | Uganda | 7.1 /100 | #218 | Tragic 4.7% |
| Nigerians | 7.0 /100 | #219 | Tragic 4.7% |
| Guamanians/Chamorros | 6.8 /100 | #220 | Tragic 4.7% |
| Choctaw | 6.1 /100 | #221 | Tragic 4.7% |
| Immigrants | Southern Europe | 6.0 /100 | #222 | Tragic 4.7% |
| Potawatomi | 5.7 /100 | #223 | Tragic 4.7% |
| Comanche | 4.8 /100 | #224 | Tragic 4.7% |
| Immigrants | Norway | 4.8 /100 | #225 | Tragic 4.7% |
Demographics Similar to Immigrants from Hungary by Unemployment Among Ages 45 to 54 years
In terms of unemployment among ages 45 to 54 years, the demographic groups most similar to Immigrants from Hungary are Immigrants from France (4.5%, a difference of 0.030%), Puget Sound Salish (4.5%, a difference of 0.040%), Immigrants from Northern Africa (4.5%, a difference of 0.050%), Immigrants from Australia (4.5%, a difference of 0.070%), and Immigrants from Russia (4.5%, a difference of 0.080%).
| Demographics | Rating | Rank | Unemployment Among Ages 45 to 54 years |
| Immigrants | Brazil | 56.4 /100 | #167 | Average 4.5% |
| Immigrants | Europe | 54.7 /100 | #168 | Average 4.5% |
| Immigrants | Egypt | 54.7 /100 | #169 | Average 4.5% |
| Spaniards | 54.3 /100 | #170 | Average 4.5% |
| Egyptians | 53.6 /100 | #171 | Average 4.5% |
| Colombians | 53.3 /100 | #172 | Average 4.5% |
| Immigrants | Colombia | 52.0 /100 | #173 | Average 4.5% |
| Immigrants | Hungary | 50.0 /100 | #174 | Average 4.5% |
| Immigrants | France | 49.4 /100 | #175 | Average 4.5% |
| Puget Sound Salish | 49.1 /100 | #176 | Average 4.5% |
| Immigrants | Northern Africa | 49.0 /100 | #177 | Average 4.5% |
| Immigrants | Australia | 48.5 /100 | #178 | Average 4.5% |
| Immigrants | Russia | 48.2 /100 | #179 | Average 4.5% |
| Malaysians | 47.5 /100 | #180 | Average 4.5% |
| Immigrants | Poland | 47.0 /100 | #181 | Average 4.5% |