Immigrants from Uganda vs African Disability
COMPARE
Immigrants from Uganda
African
Disability
Disability Comparison
Immigrants from Uganda
Africans
11.3%
DISABILITY
95.7/ 100
METRIC RATING
109th/ 347
METRIC RANK
13.0%
DISABILITY
0.0/ 100
METRIC RATING
287th/ 347
METRIC RANK
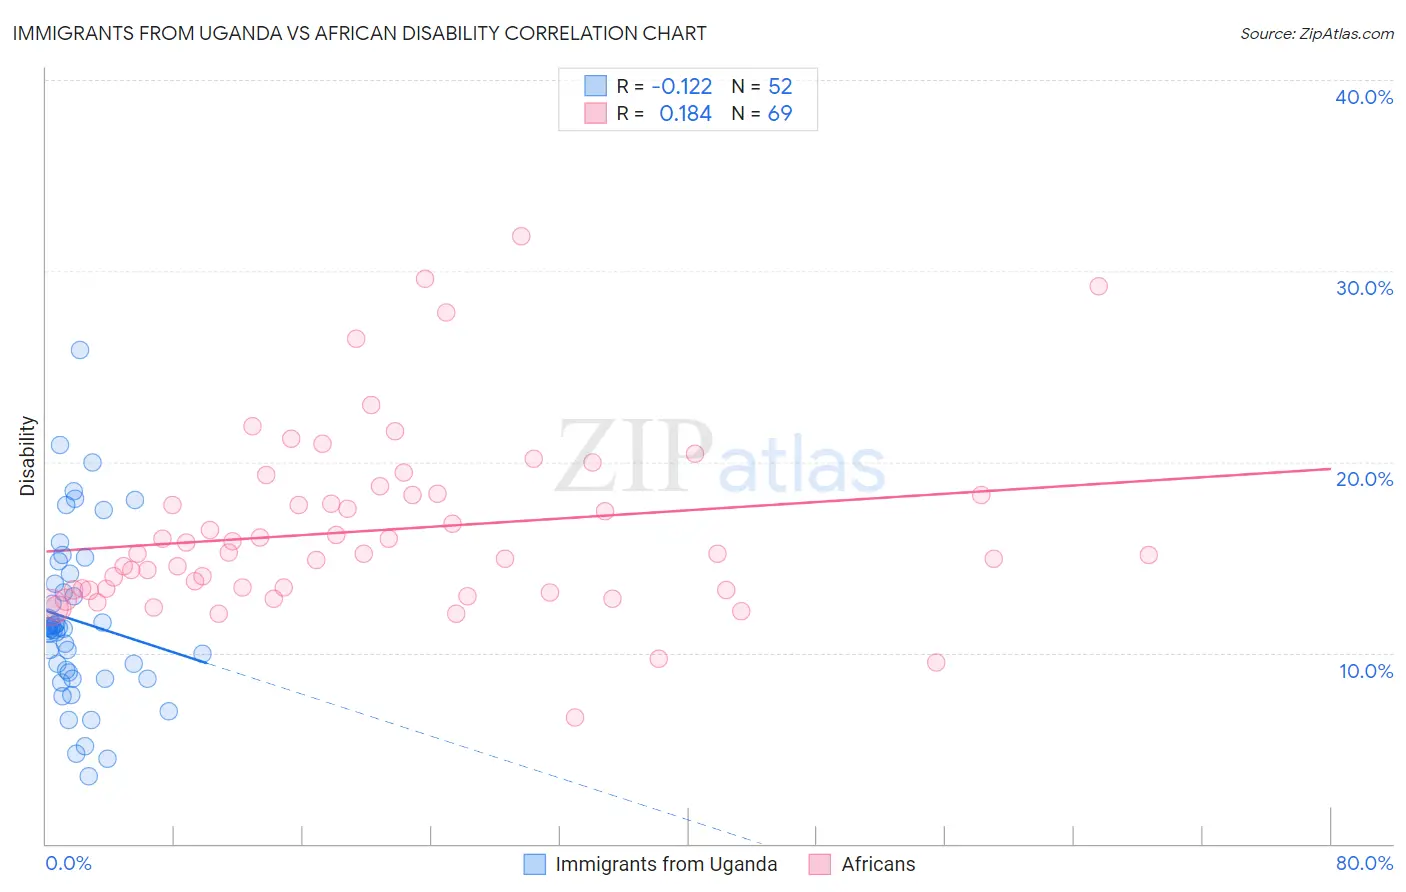
Immigrants from Uganda vs African Disability Correlation Chart
The statistical analysis conducted on geographies consisting of 125,981,344 people shows a poor negative correlation between the proportion of Immigrants from Uganda and percentage of population with a disability in the United States with a correlation coefficient (R) of -0.122 and weighted average of 11.3%. Similarly, the statistical analysis conducted on geographies consisting of 469,989,744 people shows a poor positive correlation between the proportion of Africans and percentage of population with a disability in the United States with a correlation coefficient (R) of 0.184 and weighted average of 13.0%, a difference of 15.2%.
Disability Correlation Summary
| Measurement | Immigrants from Uganda | African |
| Minimum | 3.5% | 6.6% |
| Maximum | 25.9% | 31.8% |
| Range | 22.4% | 25.2% |
| Mean | 11.7% | 16.4% |
| Median | 11.3% | 15.2% |
| Interquartile 25% (IQ1) | 8.8% | 13.3% |
| Interquartile 75% (IQ3) | 13.9% | 18.3% |
| Interquartile Range (IQR) | 5.1% | 5.0% |
| Standard Deviation (Sample) | 4.4% | 4.7% |
| Standard Deviation (Population) | 4.4% | 4.7% |
Similar Demographics by Disability
Demographics Similar to Immigrants from Uganda by Disability
In terms of disability, the demographic groups most similar to Immigrants from Uganda are Immigrants from Denmark (11.3%, a difference of 0.020%), Immigrants from Nigeria (11.3%, a difference of 0.080%), Immigrants from South Eastern Asia (11.3%, a difference of 0.080%), Nicaraguan (11.3%, a difference of 0.16%), and Immigrants from Eastern Europe (11.3%, a difference of 0.18%).
| Demographics | Rating | Rank | Disability |
| Immigrants | Eastern Africa | 96.7 /100 | #102 | Exceptional 11.3% |
| Immigrants | Uruguay | 96.4 /100 | #103 | Exceptional 11.3% |
| Immigrants | Immigrants | 96.4 /100 | #104 | Exceptional 11.3% |
| Immigrants | Kazakhstan | 96.4 /100 | #105 | Exceptional 11.3% |
| Immigrants | Eastern Europe | 96.3 /100 | #106 | Exceptional 11.3% |
| Nicaraguans | 96.2 /100 | #107 | Exceptional 11.3% |
| Immigrants | Nigeria | 96.0 /100 | #108 | Exceptional 11.3% |
| Immigrants | Uganda | 95.7 /100 | #109 | Exceptional 11.3% |
| Immigrants | Denmark | 95.6 /100 | #110 | Exceptional 11.3% |
| Immigrants | South Eastern Asia | 95.4 /100 | #111 | Exceptional 11.3% |
| Immigrants | Uzbekistan | 94.9 /100 | #112 | Exceptional 11.3% |
| Guyanese | 94.7 /100 | #113 | Exceptional 11.3% |
| Immigrants | Syria | 94.7 /100 | #114 | Exceptional 11.3% |
| Immigrants | Philippines | 94.6 /100 | #115 | Exceptional 11.3% |
| Immigrants | Northern Europe | 94.1 /100 | #116 | Exceptional 11.3% |
Demographics Similar to Africans by Disability
In terms of disability, the demographic groups most similar to Africans are White/Caucasian (13.0%, a difference of 0.020%), Slovak (13.0%, a difference of 0.020%), Cheyenne (13.0%, a difference of 0.080%), Yaqui (13.1%, a difference of 0.31%), and English (13.0%, a difference of 0.41%).
| Demographics | Rating | Rank | Disability |
| Spanish | 0.0 /100 | #280 | Tragic 12.8% |
| Immigrants | Portugal | 0.0 /100 | #281 | Tragic 12.9% |
| Scottish | 0.0 /100 | #282 | Tragic 12.9% |
| Irish | 0.0 /100 | #283 | Tragic 12.9% |
| Welsh | 0.0 /100 | #284 | Tragic 12.9% |
| Crow | 0.0 /100 | #285 | Tragic 12.9% |
| English | 0.0 /100 | #286 | Tragic 13.0% |
| Africans | 0.0 /100 | #287 | Tragic 13.0% |
| Whites/Caucasians | 0.0 /100 | #288 | Tragic 13.0% |
| Slovaks | 0.0 /100 | #289 | Tragic 13.0% |
| Cheyenne | 0.0 /100 | #290 | Tragic 13.0% |
| Yaqui | 0.0 /100 | #291 | Tragic 13.1% |
| Aleuts | 0.0 /100 | #292 | Tragic 13.1% |
| Marshallese | 0.0 /100 | #293 | Tragic 13.1% |
| Celtics | 0.0 /100 | #294 | Tragic 13.1% |