Immigrants from Uganda vs Polish Disability Age Under 5
COMPARE
Immigrants from Uganda
Polish
Disability Age Under 5
Disability Age Under 5 Comparison
Immigrants from Uganda
Poles
1.1%
DISABILITY AGE UNDER 5
96.1/ 100
METRIC RATING
101st/ 347
METRIC RANK
1.6%
DISABILITY AGE UNDER 5
0.0/ 100
METRIC RATING
296th/ 347
METRIC RANK
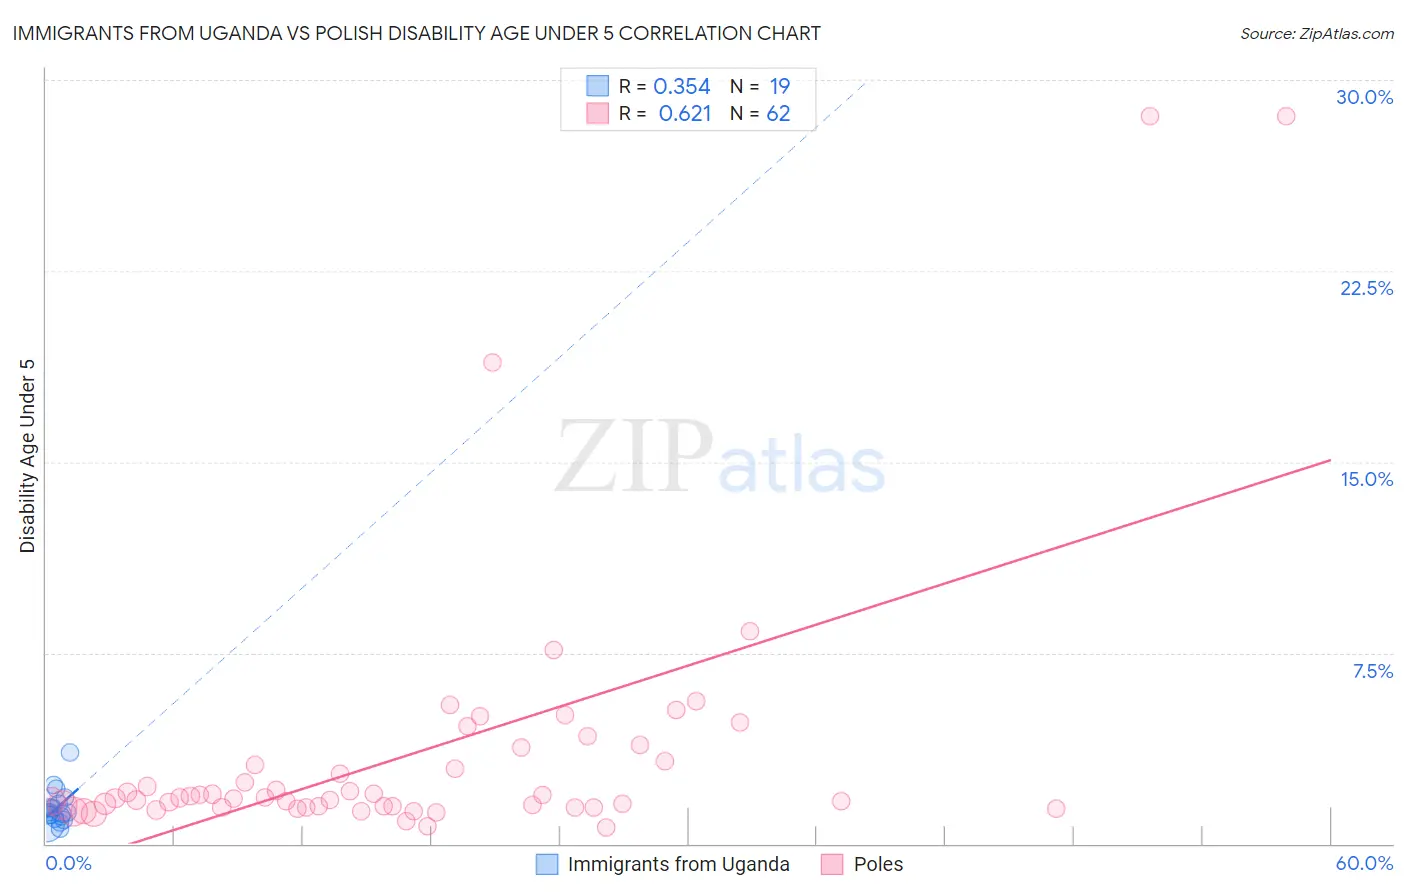
Immigrants from Uganda vs Polish Disability Age Under 5 Correlation Chart
The statistical analysis conducted on geographies consisting of 93,852,660 people shows a mild positive correlation between the proportion of Immigrants from Uganda and percentage of population with a disability under the age of 5 in the United States with a correlation coefficient (R) of 0.354 and weighted average of 1.1%. Similarly, the statistical analysis conducted on geographies consisting of 257,764,935 people shows a significant positive correlation between the proportion of Poles and percentage of population with a disability under the age of 5 in the United States with a correlation coefficient (R) of 0.621 and weighted average of 1.6%, a difference of 38.3%.
Disability Age Under 5 Correlation Summary
| Measurement | Immigrants from Uganda | Polish |
| Minimum | 0.59% | 0.65% |
| Maximum | 3.6% | 28.6% |
| Range | 3.0% | 27.9% |
| Mean | 1.4% | 3.5% |
| Median | 1.2% | 1.8% |
| Interquartile 25% (IQ1) | 0.98% | 1.4% |
| Interquartile 75% (IQ3) | 1.6% | 3.2% |
| Interquartile Range (IQR) | 0.59% | 1.8% |
| Standard Deviation (Sample) | 0.69% | 5.3% |
| Standard Deviation (Population) | 0.67% | 5.3% |
Similar Demographics by Disability Age Under 5
Demographics Similar to Immigrants from Uganda by Disability Age Under 5
In terms of disability age under 5, the demographic groups most similar to Immigrants from Uganda are Immigrants from Morocco (1.2%, a difference of 0.060%), Immigrants from Nicaragua (1.2%, a difference of 0.060%), Nicaraguan (1.1%, a difference of 0.11%), Indonesian (1.2%, a difference of 0.12%), and Dominican (1.1%, a difference of 0.14%).
| Demographics | Rating | Rank | Disability Age Under 5 |
| Sri Lankans | 96.8 /100 | #94 | Exceptional 1.1% |
| Immigrants | Moldova | 96.8 /100 | #95 | Exceptional 1.1% |
| Mongolians | 96.6 /100 | #96 | Exceptional 1.1% |
| Immigrants | Iraq | 96.5 /100 | #97 | Exceptional 1.1% |
| Immigrants | South Eastern Asia | 96.5 /100 | #98 | Exceptional 1.1% |
| Dominicans | 96.3 /100 | #99 | Exceptional 1.1% |
| Nicaraguans | 96.3 /100 | #100 | Exceptional 1.1% |
| Immigrants | Uganda | 96.1 /100 | #101 | Exceptional 1.1% |
| Immigrants | Morocco | 96.0 /100 | #102 | Exceptional 1.2% |
| Immigrants | Nicaragua | 96.0 /100 | #103 | Exceptional 1.2% |
| Indonesians | 95.9 /100 | #104 | Exceptional 1.2% |
| Immigrants | South Africa | 95.6 /100 | #105 | Exceptional 1.2% |
| Cambodians | 95.4 /100 | #106 | Exceptional 1.2% |
| Immigrants | West Indies | 95.3 /100 | #107 | Exceptional 1.2% |
| Iraqis | 95.1 /100 | #108 | Exceptional 1.2% |
Demographics Similar to Poles by Disability Age Under 5
In terms of disability age under 5, the demographic groups most similar to Poles are Finnish (1.6%, a difference of 0.080%), Swedish (1.6%, a difference of 0.71%), Nonimmigrants (1.6%, a difference of 0.96%), Cajun (1.6%, a difference of 0.96%), and Portuguese (1.6%, a difference of 1.5%).
| Demographics | Rating | Rank | Disability Age Under 5 |
| Hungarians | 0.0 /100 | #289 | Tragic 1.5% |
| Czechs | 0.0 /100 | #290 | Tragic 1.5% |
| Northern Europeans | 0.0 /100 | #291 | Tragic 1.6% |
| Italians | 0.0 /100 | #292 | Tragic 1.6% |
| Lithuanians | 0.0 /100 | #293 | Tragic 1.6% |
| Swedes | 0.0 /100 | #294 | Tragic 1.6% |
| Finns | 0.0 /100 | #295 | Tragic 1.6% |
| Poles | 0.0 /100 | #296 | Tragic 1.6% |
| Immigrants | Nonimmigrants | 0.0 /100 | #297 | Tragic 1.6% |
| Cajuns | 0.0 /100 | #298 | Tragic 1.6% |
| Portuguese | 0.0 /100 | #299 | Tragic 1.6% |
| Shoshone | 0.0 /100 | #300 | Tragic 1.6% |
| German Russians | 0.0 /100 | #301 | Tragic 1.6% |
| Welsh | 0.0 /100 | #302 | Tragic 1.6% |
| Swiss | 0.0 /100 | #303 | Tragic 1.6% |