Immigrants from Turkey vs Uruguayan 1st Grade

COMPARE

Immigrants from Turkey
Race
Ancestry
AfghanAfricanAlaska NativeAlaskan AthabascanAlbanianAleutAlsatianAmericanApacheArabArapahoArgentineanArmenianAssyrian/Chaldean/SyriacAustralianAustrianBahamianBangladeshiBarbadianBasqueBelgianBelizeanBermudanBhutaneseBlackfeetBolivianBrazilianBritishBritish West IndianBulgarianBurmeseCajunCambodianCanadianCape VerdeanCarpatho RusynCelticCentral AmericanCentral American IndianCherokeeCheyenneChickasawChileanChineseChippewaChoctawColombianColvilleComancheCosta RicanCreeCreekCroatianCrowCubanCypriotCzechCzechoslovakianDanishDelawareDominicanDutchDutch West IndianEastern EuropeanEcuadorianEgyptianEnglishEstonianEthiopianEuropeanFijianFilipinoFinnishFrenchFrench American IndianFrench CanadianGermanGerman RussianGhanaianGreekGuamanian/ChamorroGuatemalanGuyaneseHaitianHmongHonduranHopiHoumaHungarianIcelanderIndian (Asian)IndonesianInupiatIranianIraqiIrishIroquoisIsraeliItalianJamaicanJapaneseJordanianKenyanKiowaKoreanLaotianLatvianLebaneseLiberianLithuanianLumbeeLuxembourgerMacedonianMalaysianMalteseMarshalleseMenomineeMexicanMexican American IndianMongolianMoroccanNative HawaiianNavajoNepaleseNew ZealanderNicaraguanNigerianNorthern EuropeanNorwegianOkinawanOsageOttawaPaiutePakistaniPalestinianPanamanianParaguayanPennsylvania GermanPeruvianPimaPolishPortuguesePotawatomiPuebloPuerto RicanPuget Sound SalishRomanianRussianSalvadoranSamoanScandinavianScotch-IrishScottishSeminoleSenegaleseSerbianShoshoneSierra LeoneanSiouxSlavicSlovakSloveneSomaliSouth AfricanSouth AmericanSouth American IndianSoviet UnionSpaniardSpanishSpanish AmericanSpanish American IndianSri LankanSubsaharan AfricanSudaneseSwedishSwissSyrianTaiwaneseThaiTlingit-HaidaTohono O'OdhamTonganTrinidadian and TobagonianTsimshianTurkishU.S. Virgin IslanderUgandanUkrainianUteVenezuelanVietnameseWelshWest IndianYakamaYaquiYugoslavianYumanYup'ikZimbabwean
Immigration
NonimmigrantsImmigrantsAfghanistanAfricaAlbaniaArgentinaArmeniaAsiaAustraliaAustriaBahamasBangladeshBarbadosBelarusBelgiumBelizeBoliviaBosnia and HerzegovinaBrazilBulgariaBurma/MyanmarCabo VerdeCambodiaCameroonCanadaCaribbeanCentral AmericaChileChinaColombiaCongoCosta RicaCroatiaCubaCzechoslovakiaDenmarkDominicaDominican RepublicEastern AfricaEastern AsiaEastern EuropeEcuadorEgyptEl SalvadorEnglandEritreaEthiopiaEuropeFijiFranceGermanyGhanaGreeceGrenadaGuatemalaGuyanaHaitiHondurasHong KongHungaryIndiaIndonesiaIranIraqIrelandIsraelItalyJamaicaJapanJordanKazakhstanKenyaKoreaKuwaitLaosLatin AmericaLatviaLebanonLiberiaLithuaniaMalaysiaMexicoMicronesiaMiddle AfricaMoldovaMoroccoNepalNetherlandsNicaraguaNigeriaNorth AmericaNorth MacedoniaNorthern AfricaNorthern EuropeNorwayOceaniaPakistanPanamaPeruPhilippinesPolandPortugalRomaniaRussiaSaudi ArabiaScotlandSenegalSerbiaSierra LeoneSingaporeSomaliaSouth AfricaSouth AmericaSouth Central AsiaSouth Eastern AsiaSouthern EuropeSpainSri LankaSt. Vincent and the GrenadinesSudanSwedenSwitzerlandSyriaTaiwanThailandTrinidad and TobagoTurkeyUgandaUkraineUruguayUzbekistanVenezuelaVietnamWest IndiesWestern AfricaWestern AsiaWestern EuropeYemenZaireZimbabweAzores
Uruguayan
Race
Ancestry
AfghanAfricanAlaska NativeAlaskan AthabascanAlbanianAleutAlsatianAmericanApacheArabArapahoArgentineanArmenianAssyrian/Chaldean/SyriacAustralianAustrianBahamianBangladeshiBarbadianBasqueBelgianBelizeanBermudanBhutaneseBlackfeetBolivianBrazilianBritishBritish West IndianBulgarianBurmeseCajunCambodianCanadianCape VerdeanCarpatho RusynCelticCentral AmericanCentral American IndianCherokeeCheyenneChickasawChileanChineseChippewaChoctawColombianColvilleComancheCosta RicanCreeCreekCroatianCrowCubanCypriotCzechCzechoslovakianDanishDelawareDominicanDutchDutch West IndianEastern EuropeanEcuadorianEgyptianEnglishEstonianEthiopianEuropeanFijianFilipinoFinnishFrenchFrench American IndianFrench CanadianGermanGerman RussianGhanaianGreekGuamanian/ChamorroGuatemalanGuyaneseHaitianHmongHonduranHopiHoumaHungarianIcelanderIndian (Asian)IndonesianInupiatIranianIraqiIrishIroquoisIsraeliItalianJamaicanJapaneseJordanianKenyanKiowaKoreanLaotianLatvianLebaneseLiberianLithuanianLumbeeLuxembourgerMacedonianMalaysianMalteseMarshalleseMenomineeMexicanMexican American IndianMongolianMoroccanNative HawaiianNavajoNepaleseNew ZealanderNicaraguanNigerianNorthern EuropeanNorwegianOkinawanOsageOttawaPaiutePakistaniPalestinianPanamanianParaguayanPennsylvania GermanPeruvianPimaPolishPortuguesePotawatomiPuebloPuerto RicanPuget Sound SalishRomanianRussianSalvadoranSamoanScandinavianScotch-IrishScottishSeminoleSenegaleseSerbianShoshoneSierra LeoneanSiouxSlavicSlovakSloveneSomaliSouth AfricanSouth AmericanSouth American IndianSoviet UnionSpaniardSpanishSpanish AmericanSpanish American IndianSri LankanSubsaharan AfricanSudaneseSwedishSwissSyrianTaiwaneseThaiTlingit-HaidaTohono O'OdhamTonganTrinidadian and TobagonianTsimshianTurkishU.S. Virgin IslanderUgandanUkrainianUruguayanUteVenezuelanVietnameseWelshWest IndianYakamaYaquiYugoslavianYumanYup'ikZimbabwean
Immigration
NonimmigrantsImmigrantsAfghanistanAfricaAlbaniaArgentinaArmeniaAsiaAustraliaAustriaBahamasBangladeshBarbadosBelarusBelgiumBelizeBoliviaBosnia and HerzegovinaBrazilBulgariaBurma/MyanmarCabo VerdeCambodiaCameroonCanadaCaribbeanCentral AmericaChileChinaColombiaCongoCosta RicaCroatiaCubaCzechoslovakiaDenmarkDominicaDominican RepublicEastern AfricaEastern AsiaEastern EuropeEcuadorEgyptEl SalvadorEnglandEritreaEthiopiaEuropeFijiFranceGermanyGhanaGreeceGrenadaGuatemalaGuyanaHaitiHondurasHong KongHungaryIndiaIndonesiaIranIraqIrelandIsraelItalyJamaicaJapanJordanKazakhstanKenyaKoreaKuwaitLaosLatin AmericaLatviaLebanonLiberiaLithuaniaMalaysiaMexicoMicronesiaMiddle AfricaMoldovaMoroccoNepalNetherlandsNicaraguaNigeriaNorth AmericaNorth MacedoniaNorthern AfricaNorthern EuropeNorwayOceaniaPakistanPanamaPeruPhilippinesPolandPortugalRomaniaRussiaSaudi ArabiaScotlandSenegalSerbiaSierra LeoneSingaporeSomaliaSouth AfricaSouth AmericaSouth Central AsiaSouth Eastern AsiaSouthern EuropeSpainSri LankaSt. Vincent and the GrenadinesSudanSwedenSwitzerlandSyriaTaiwanThailandTrinidad and TobagoUgandaUkraineUruguayUzbekistanVenezuelaVietnamWest IndiesWestern AfricaWestern AsiaWestern EuropeYemenZaireZimbabweAzores
1st Grade
Income
Poverty
Unemployment
Labor Participation
Family Structure
Vehicle Availability
Education Level
Disability

1st Grade Comparison

Immigrants from Turkey

Uruguayans

Excellent
Tragic
98.0%
1ST GRADE
82.8/ 100
METRIC RATING
141st/ 347
METRIC RANK
97.7%
1ST GRADE
7.4/ 100
METRIC RATING
216th/ 347
METRIC RANK

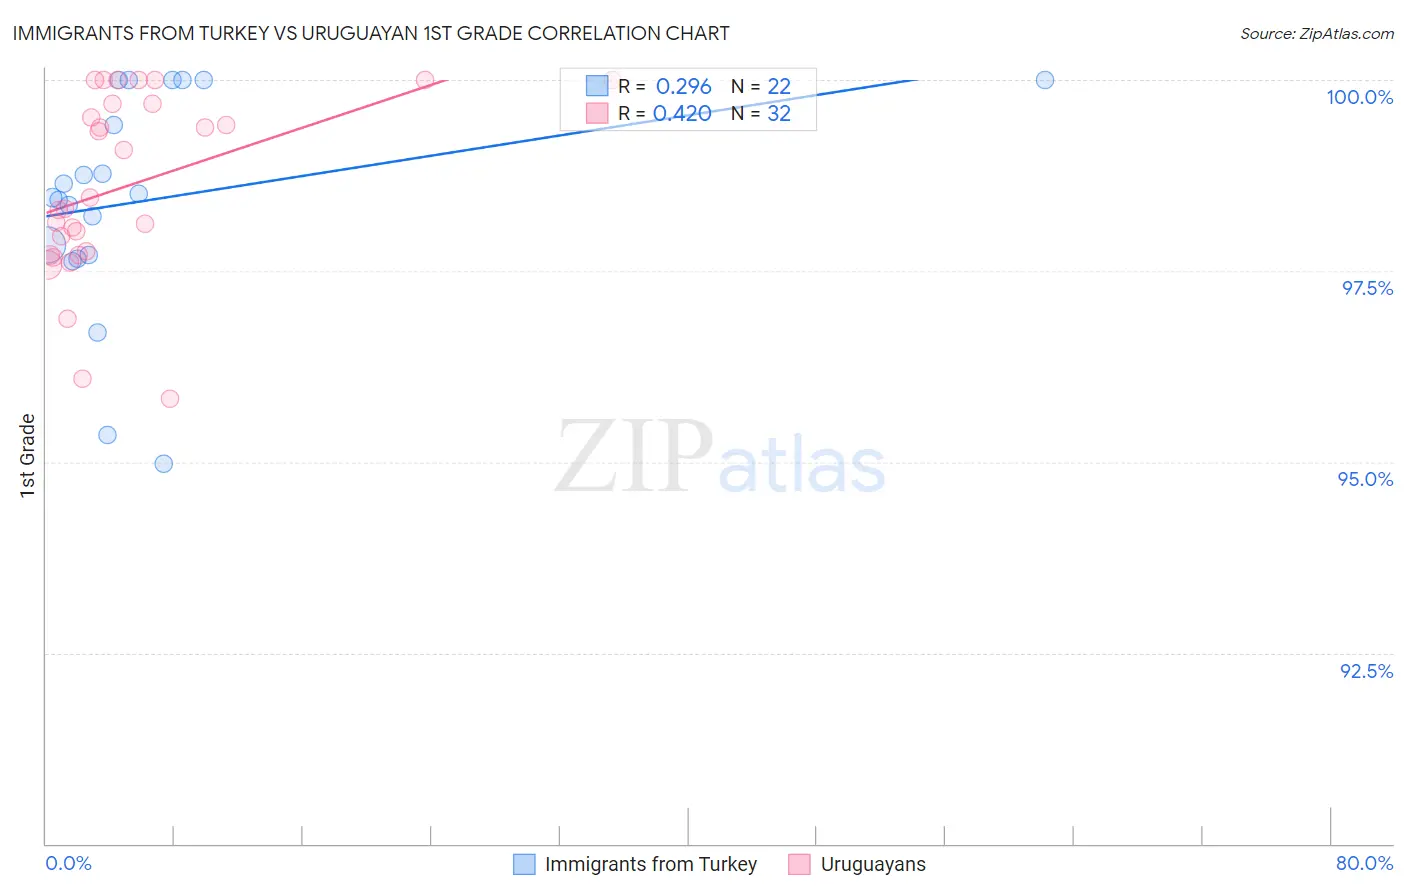
Immigrants from Turkey vs Uruguayan 1st Grade Correlation Chart

The statistical analysis conducted on geographies consisting of 223,057,877 people shows a weak positive correlation between the proportion of Immigrants from Turkey and percentage of population with at least 1st grade education in the United States with a correlation coefficient (R) of 0.296 and weighted average of 98.0%. Similarly, the statistical analysis conducted on geographies consisting of 144,782,794 people shows a moderate positive correlation between the proportion of Uruguayans and percentage of population with at least 1st grade education in the United States with a correlation coefficient (R) of 0.420 and weighted average of 97.7%, a difference of 0.32%.
Immigrants from Turkey vs Uruguayan 1st Grade

1st Grade Correlation Summary

MeasurementImmigrants from TurkeyUruguayan
Minimum95.0%95.8%
Maximum100.0%100.0%
Range5.0%4.2%
Mean98.4%98.6%
Median98.5%98.4%
Interquartile 25% (IQ1)97.7%97.7%
Interquartile 75% (IQ3)100.0%99.7%
Interquartile Range (IQR)2.3%2.0%
Standard Deviation (Sample)1.4%1.2%
Standard Deviation (Population)1.4%1.2%

Similar Demographics by 1st Grade

Demographics Similar to Immigrants from Turkey by 1st Grade

In terms of 1st grade, the demographic groups most similar to Immigrants from Turkey are Palestinian (98.0%, a difference of 0.0%), Marshallese (98.0%, a difference of 0.0%), Burmese (98.0%, a difference of 0.010%), Alsatian (98.0%, a difference of 0.010%), and Hmong (98.0%, a difference of 0.020%).
DemographicsRating | Rank1st Grade
Immigrants | Hungary
89.4
/100
|
#134
Excellent
98.1%
Immigrants | Kuwait
89.3
/100
|
#135
Excellent
98.1%
Immigrants | Bulgaria
88.8
/100
|
#136
Excellent
98.1%
Israelis
87.8
/100
|
#137
Excellent
98.1%
Immigrants | Romania
87.8
/100
|
#138
Excellent
98.1%
Blackfeet
87.6
/100
|
#139
Excellent
98.1%
Palestinians
83.0
/100
|
#140
Excellent
98.0%
Immigrants | Turkey
82.8
/100
|
#141
Excellent
98.0%
Marshallese
82.0
/100
|
#142
Excellent
98.0%
Burmese
81.0
/100
|
#143
Excellent
98.0%
Alsatians
80.9
/100
|
#144
Excellent
98.0%
Hmong
79.0
/100
|
#145
Good
98.0%
Immigrants | Israel
77.8
/100
|
#146
Good
98.0%
Filipinos
77.6
/100
|
#147
Good
98.0%
Apache
75.2
/100
|
#148
Good
98.0%

Demographics Similar to Uruguayans by 1st Grade

In terms of 1st grade, the demographic groups most similar to Uruguayans are South American Indian (97.7%, a difference of 0.0%), Bahamian (97.7%, a difference of 0.0%), Moroccan (97.7%, a difference of 0.010%), Immigrants from Bahamas (97.7%, a difference of 0.010%), and Samoan (97.7%, a difference of 0.010%).
DemographicsRating | Rank1st Grade
Costa Ricans
11.6
/100
|
#209
Poor
97.8%
Immigrants | Oceania
11.0
/100
|
#210
Poor
97.8%
Laotians
10.3
/100
|
#211
Poor
97.8%
Moroccans
8.7
/100
|
#212
Tragic
97.7%
Immigrants | Bahamas
8.1
/100
|
#213
Tragic
97.7%
South American Indians
7.6
/100
|
#214
Tragic
97.7%
Bahamians
7.5
/100
|
#215
Tragic
97.7%
Uruguayans
7.4
/100
|
#216
Tragic
97.7%
Samoans
6.8
/100
|
#217
Tragic
97.7%
Immigrants | Morocco
5.3
/100
|
#218
Tragic
97.7%
Immigrants | Panama
5.2
/100
|
#219
Tragic
97.7%
Tongans
4.6
/100
|
#220
Tragic
97.7%
Immigrants | Sudan
4.3
/100
|
#221
Tragic
97.7%
Immigrants | Syria
4.2
/100
|
#222
Tragic
97.7%
Immigrants | Zaire
4.1
/100
|
#223
Tragic
97.7%