Immigrants from Turkey vs Uruguayan Female Poverty Among 18-24 Year Olds
COMPARE
Immigrants from Turkey
Uruguayan
Female Poverty Among 18-24 Year Olds
Female Poverty Among 18-24 Year Olds Comparison
Immigrants from Turkey
Uruguayans
20.5%
FEMALE POVERTY AMONG 18-24 YEAR OLDS
17.7/ 100
METRIC RATING
202nd/ 347
METRIC RANK
18.8%
FEMALE POVERTY AMONG 18-24 YEAR OLDS
99.5/ 100
METRIC RATING
79th/ 347
METRIC RANK
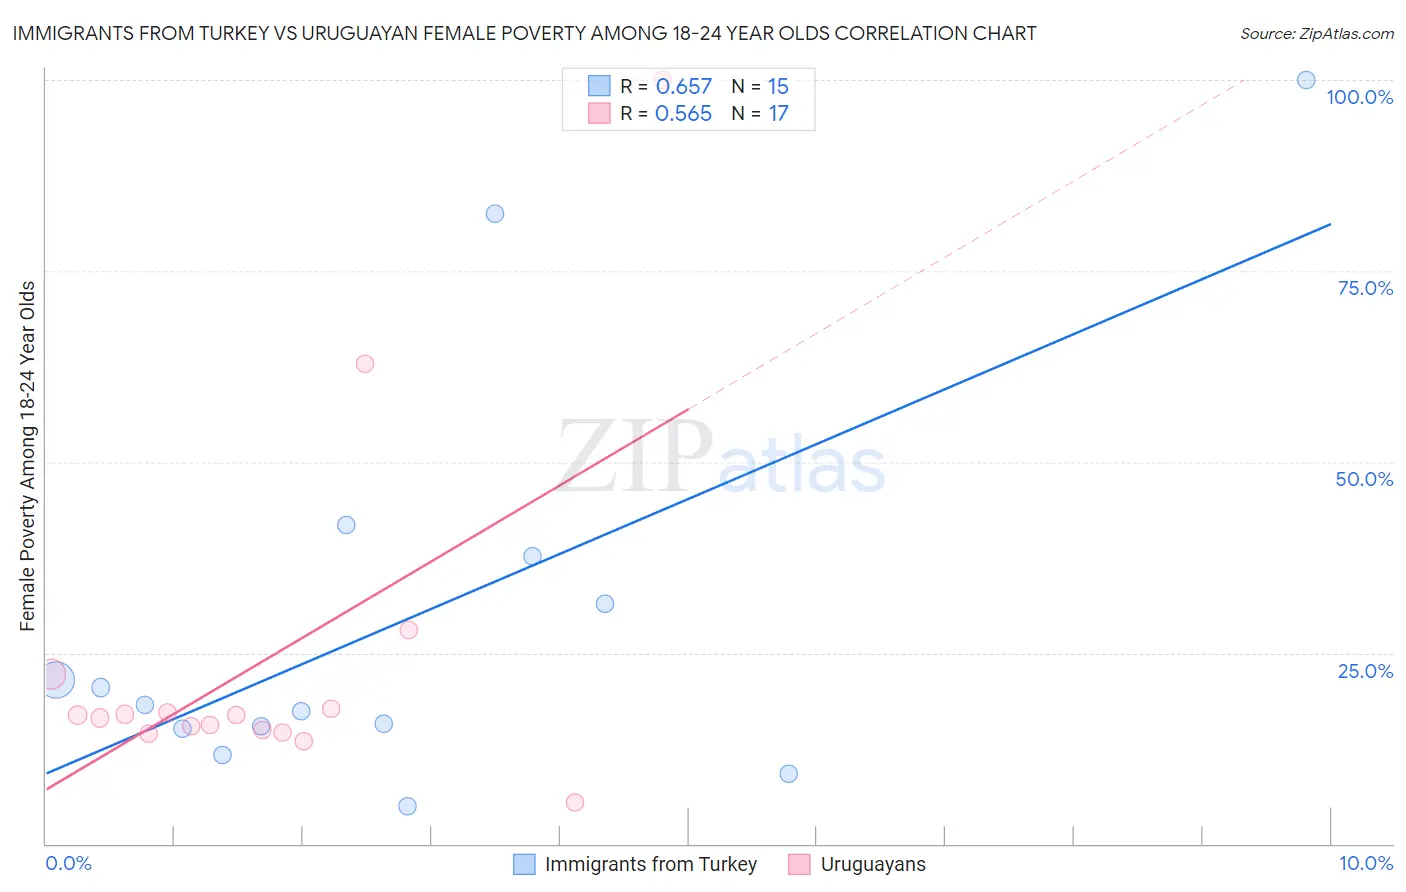
Immigrants from Turkey vs Uruguayan Female Poverty Among 18-24 Year Olds Correlation Chart
The statistical analysis conducted on geographies consisting of 219,469,161 people shows a significant positive correlation between the proportion of Immigrants from Turkey and poverty level among females between the ages 18 and 24 in the United States with a correlation coefficient (R) of 0.657 and weighted average of 20.5%. Similarly, the statistical analysis conducted on geographies consisting of 143,433,790 people shows a substantial positive correlation between the proportion of Uruguayans and poverty level among females between the ages 18 and 24 in the United States with a correlation coefficient (R) of 0.565 and weighted average of 18.8%, a difference of 8.9%.
Female Poverty Among 18-24 Year Olds Correlation Summary
| Measurement | Immigrants from Turkey | Uruguayan |
| Minimum | 5.0% | 5.4% |
| Maximum | 100.0% | 100.0% |
| Range | 95.0% | 94.6% |
| Mean | 29.5% | 24.0% |
| Median | 18.2% | 16.9% |
| Interquartile 25% (IQ1) | 15.0% | 14.7% |
| Interquartile 75% (IQ3) | 37.7% | 19.9% |
| Interquartile Range (IQR) | 22.6% | 5.2% |
| Standard Deviation (Sample) | 27.2% | 23.0% |
| Standard Deviation (Population) | 26.3% | 22.3% |
Similar Demographics by Female Poverty Among 18-24 Year Olds
Demographics Similar to Immigrants from Turkey by Female Poverty Among 18-24 Year Olds
In terms of female poverty among 18-24 year olds, the demographic groups most similar to Immigrants from Turkey are Immigrants from Malaysia (20.5%, a difference of 0.040%), Mexican (20.5%, a difference of 0.050%), Immigrants from Netherlands (20.5%, a difference of 0.060%), English (20.5%, a difference of 0.080%), and Hispanic or Latino (20.5%, a difference of 0.090%).
| Demographics | Rating | Rank | Female Poverty Among 18-24 Year Olds |
| Immigrants | Latvia | 23.0 /100 | #195 | Fair 20.4% |
| Czechs | 22.3 /100 | #196 | Fair 20.4% |
| Zimbabweans | 21.0 /100 | #197 | Fair 20.4% |
| Immigrants | Spain | 20.7 /100 | #198 | Fair 20.4% |
| Germans | 20.6 /100 | #199 | Fair 20.4% |
| Europeans | 19.9 /100 | #200 | Poor 20.4% |
| Mexicans | 18.3 /100 | #201 | Poor 20.5% |
| Immigrants | Turkey | 17.7 /100 | #202 | Poor 20.5% |
| Immigrants | Malaysia | 17.2 /100 | #203 | Poor 20.5% |
| Immigrants | Netherlands | 17.0 /100 | #204 | Poor 20.5% |
| English | 16.7 /100 | #205 | Poor 20.5% |
| Hispanics or Latinos | 16.6 /100 | #206 | Poor 20.5% |
| Spaniards | 16.3 /100 | #207 | Poor 20.5% |
| Dutch | 15.9 /100 | #208 | Poor 20.5% |
| Arabs | 15.5 /100 | #209 | Poor 20.5% |
Demographics Similar to Uruguayans by Female Poverty Among 18-24 Year Olds
In terms of female poverty among 18-24 year olds, the demographic groups most similar to Uruguayans are Immigrants from Europe (18.8%, a difference of 0.0%), Costa Rican (18.8%, a difference of 0.010%), Palestinian (18.8%, a difference of 0.080%), Japanese (18.8%, a difference of 0.080%), and Immigrants from Cambodia (18.8%, a difference of 0.11%).
| Demographics | Rating | Rank | Female Poverty Among 18-24 Year Olds |
| Armenians | 99.7 /100 | #72 | Exceptional 18.7% |
| Lithuanians | 99.7 /100 | #73 | Exceptional 18.7% |
| Hawaiians | 99.6 /100 | #74 | Exceptional 18.7% |
| Poles | 99.6 /100 | #75 | Exceptional 18.8% |
| Immigrants | Cambodia | 99.5 /100 | #76 | Exceptional 18.8% |
| Costa Ricans | 99.5 /100 | #77 | Exceptional 18.8% |
| Immigrants | Europe | 99.5 /100 | #78 | Exceptional 18.8% |
| Uruguayans | 99.5 /100 | #79 | Exceptional 18.8% |
| Palestinians | 99.5 /100 | #80 | Exceptional 18.8% |
| Japanese | 99.5 /100 | #81 | Exceptional 18.8% |
| Immigrants | Uruguay | 99.4 /100 | #82 | Exceptional 18.8% |
| Immigrants | Indonesia | 99.4 /100 | #83 | Exceptional 18.9% |
| Burmese | 99.2 /100 | #84 | Exceptional 18.9% |
| Immigrants | Armenia | 99.2 /100 | #85 | Exceptional 18.9% |
| Immigrants | Iraq | 99.2 /100 | #86 | Exceptional 18.9% |