Immigrants from Turkey vs Belizean Male Disability
COMPARE
Immigrants from Turkey
Belizean
Male Disability
Male Disability Comparison
Immigrants from Turkey
Belizeans
10.2%
MALE DISABILITY
99.9/ 100
METRIC RATING
34th/ 347
METRIC RANK
11.4%
MALE DISABILITY
21.2/ 100
METRIC RATING
194th/ 347
METRIC RANK
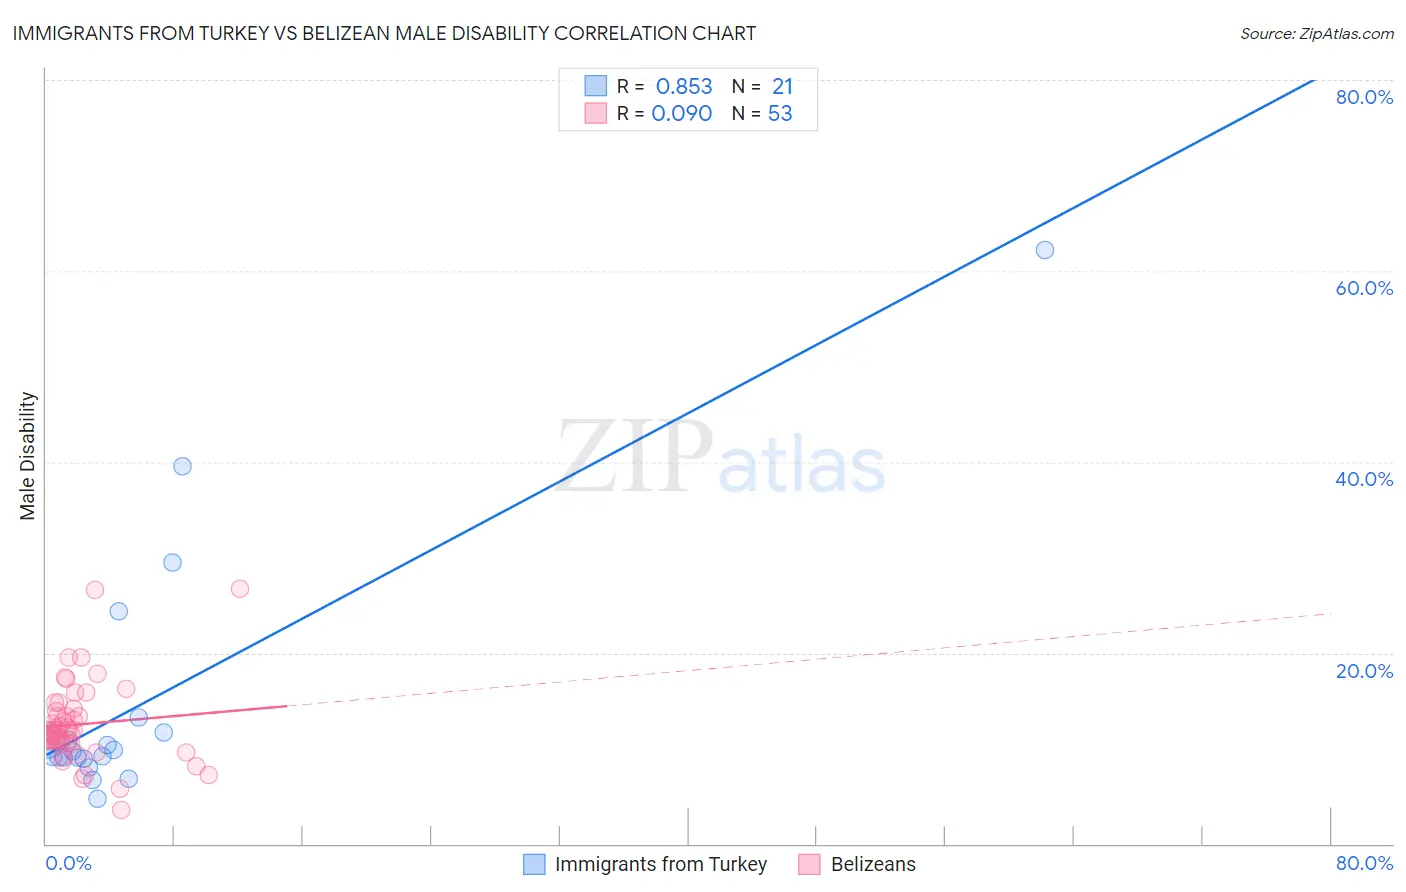
Immigrants from Turkey vs Belizean Male Disability Correlation Chart
The statistical analysis conducted on geographies consisting of 223,048,853 people shows a very strong positive correlation between the proportion of Immigrants from Turkey and percentage of males with a disability in the United States with a correlation coefficient (R) of 0.853 and weighted average of 10.2%. Similarly, the statistical analysis conducted on geographies consisting of 144,197,719 people shows a slight positive correlation between the proportion of Belizeans and percentage of males with a disability in the United States with a correlation coefficient (R) of 0.090 and weighted average of 11.4%, a difference of 12.0%.
Male Disability Correlation Summary
| Measurement | Immigrants from Turkey | Belizean |
| Minimum | 4.8% | 3.6% |
| Maximum | 62.2% | 26.7% |
| Range | 57.4% | 23.1% |
| Mean | 14.9% | 12.5% |
| Median | 9.7% | 11.6% |
| Interquartile 25% (IQ1) | 9.0% | 10.6% |
| Interquartile 75% (IQ3) | 12.5% | 14.0% |
| Interquartile Range (IQR) | 3.5% | 3.4% |
| Standard Deviation (Sample) | 13.7% | 4.3% |
| Standard Deviation (Population) | 13.4% | 4.2% |
Similar Demographics by Male Disability
Demographics Similar to Immigrants from Turkey by Male Disability
In terms of male disability, the demographic groups most similar to Immigrants from Turkey are Immigrants from Ethiopia (10.2%, a difference of 0.060%), Immigrants from Argentina (10.2%, a difference of 0.11%), Ethiopian (10.2%, a difference of 0.16%), Immigrants from Indonesia (10.2%, a difference of 0.24%), and Immigrants from Kuwait (10.2%, a difference of 0.41%).
| Demographics | Rating | Rank | Male Disability |
| Egyptians | 99.9 /100 | #27 | Exceptional 10.1% |
| Vietnamese | 99.9 /100 | #28 | Exceptional 10.1% |
| Venezuelans | 99.9 /100 | #29 | Exceptional 10.1% |
| Immigrants | Egypt | 99.9 /100 | #30 | Exceptional 10.1% |
| Soviet Union | 99.9 /100 | #31 | Exceptional 10.1% |
| Argentineans | 99.9 /100 | #32 | Exceptional 10.1% |
| Immigrants | Ethiopia | 99.9 /100 | #33 | Exceptional 10.2% |
| Immigrants | Turkey | 99.9 /100 | #34 | Exceptional 10.2% |
| Immigrants | Argentina | 99.9 /100 | #35 | Exceptional 10.2% |
| Ethiopians | 99.8 /100 | #36 | Exceptional 10.2% |
| Immigrants | Indonesia | 99.8 /100 | #37 | Exceptional 10.2% |
| Immigrants | Kuwait | 99.8 /100 | #38 | Exceptional 10.2% |
| Afghans | 99.8 /100 | #39 | Exceptional 10.2% |
| Immigrants | Nepal | 99.8 /100 | #40 | Exceptional 10.3% |
| Taiwanese | 99.8 /100 | #41 | Exceptional 10.3% |
Demographics Similar to Belizeans by Male Disability
In terms of male disability, the demographic groups most similar to Belizeans are Immigrants from Oceania (11.4%, a difference of 0.030%), Greek (11.4%, a difference of 0.080%), Assyrian/Chaldean/Syriac (11.4%, a difference of 0.15%), Senegalese (11.4%, a difference of 0.16%), and West Indian (11.4%, a difference of 0.24%).
| Demographics | Rating | Rank | Male Disability |
| Immigrants | Austria | 27.3 /100 | #187 | Fair 11.4% |
| Estonians | 26.8 /100 | #188 | Fair 11.4% |
| Immigrants | Netherlands | 25.9 /100 | #189 | Fair 11.4% |
| Immigrants | Bosnia and Herzegovina | 25.4 /100 | #190 | Fair 11.4% |
| Senegalese | 23.2 /100 | #191 | Fair 11.4% |
| Assyrians/Chaldeans/Syriacs | 23.2 /100 | #192 | Fair 11.4% |
| Greeks | 22.2 /100 | #193 | Fair 11.4% |
| Belizeans | 21.2 /100 | #194 | Fair 11.4% |
| Immigrants | Oceania | 20.9 /100 | #195 | Fair 11.4% |
| West Indians | 18.4 /100 | #196 | Poor 11.4% |
| Somalis | 18.2 /100 | #197 | Poor 11.4% |
| Immigrants | Jamaica | 16.3 /100 | #198 | Poor 11.5% |
| Lebanese | 15.4 /100 | #199 | Poor 11.5% |
| Immigrants | Iraq | 13.0 /100 | #200 | Poor 11.5% |
| Immigrants | Panama | 13.0 /100 | #201 | Poor 11.5% |