Central American Indian vs Immigrants Disability Age Under 5
COMPARE
Central American Indian
Immigrants
Disability Age Under 5
Disability Age Under 5 Comparison
Central American Indians
Immigrants
1.3%
DISABILITY AGE UNDER 5
3.6/ 100
METRIC RATING
235th/ 347
METRIC RANK
1.2%
DISABILITY AGE UNDER 5
88.0/ 100
METRIC RATING
129th/ 347
METRIC RANK
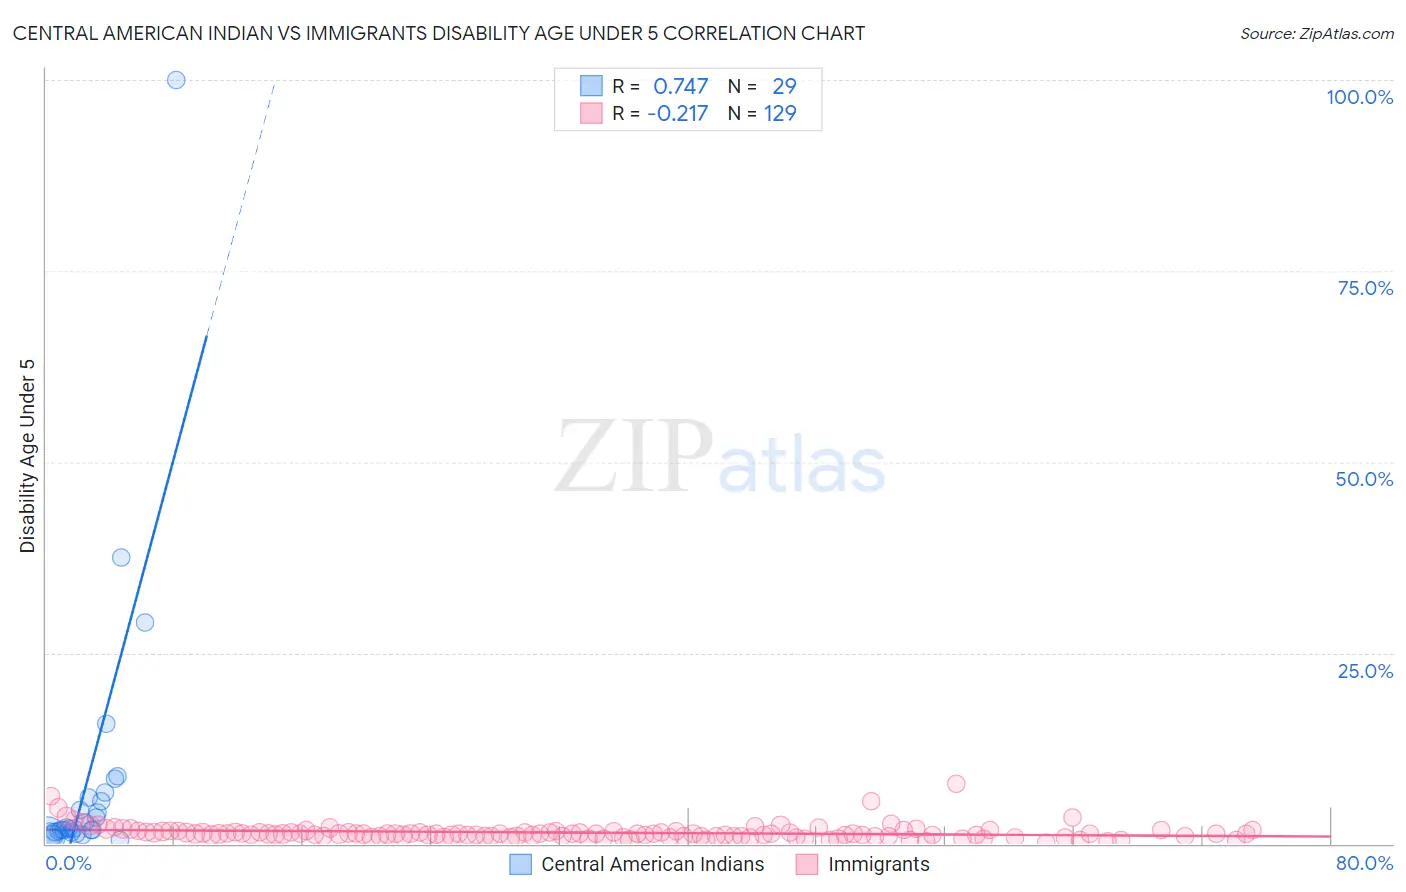
Central American Indian vs Immigrants Disability Age Under 5 Correlation Chart
The statistical analysis conducted on geographies consisting of 195,946,772 people shows a strong positive correlation between the proportion of Central American Indians and percentage of population with a disability under the age of 5 in the United States with a correlation coefficient (R) of 0.747 and weighted average of 1.3%. Similarly, the statistical analysis conducted on geographies consisting of 262,190,696 people shows a weak negative correlation between the proportion of Immigrants and percentage of population with a disability under the age of 5 in the United States with a correlation coefficient (R) of -0.217 and weighted average of 1.2%, a difference of 12.5%.
Disability Age Under 5 Correlation Summary
| Measurement | Central American Indian | Immigrants |
| Minimum | 0.56% | 0.14% |
| Maximum | 100.0% | 7.9% |
| Range | 99.4% | 7.8% |
| Mean | 8.9% | 1.5% |
| Median | 1.9% | 1.3% |
| Interquartile 25% (IQ1) | 1.5% | 1.0% |
| Interquartile 75% (IQ3) | 6.5% | 1.5% |
| Interquartile Range (IQR) | 4.9% | 0.54% |
| Standard Deviation (Sample) | 19.4% | 1.0% |
| Standard Deviation (Population) | 19.1% | 1.0% |
Similar Demographics by Disability Age Under 5
Demographics Similar to Central American Indians by Disability Age Under 5
In terms of disability age under 5, the demographic groups most similar to Central American Indians are Pueblo (1.3%, a difference of 0.070%), South American Indian (1.3%, a difference of 0.20%), Tongan (1.3%, a difference of 0.33%), Basque (1.3%, a difference of 0.44%), and French American Indian (1.3%, a difference of 0.45%).
| Demographics | Rating | Rank | Disability Age Under 5 |
| Luxembourgers | 6.1 /100 | #228 | Tragic 1.3% |
| Immigrants | Costa Rica | 5.5 /100 | #229 | Tragic 1.3% |
| Lebanese | 5.3 /100 | #230 | Tragic 1.3% |
| Immigrants | Northern Europe | 4.7 /100 | #231 | Tragic 1.3% |
| French American Indians | 4.5 /100 | #232 | Tragic 1.3% |
| Tongans | 4.2 /100 | #233 | Tragic 1.3% |
| Pueblo | 3.8 /100 | #234 | Tragic 1.3% |
| Central American Indians | 3.6 /100 | #235 | Tragic 1.3% |
| South American Indians | 3.3 /100 | #236 | Tragic 1.3% |
| Basques | 3.0 /100 | #237 | Tragic 1.3% |
| Spanish American Indians | 2.4 /100 | #238 | Tragic 1.3% |
| Immigrants | Austria | 2.3 /100 | #239 | Tragic 1.3% |
| Native Hawaiians | 2.2 /100 | #240 | Tragic 1.3% |
| Maltese | 2.2 /100 | #241 | Tragic 1.3% |
| Lumbee | 2.1 /100 | #242 | Tragic 1.3% |
Demographics Similar to Immigrants by Disability Age Under 5
In terms of disability age under 5, the demographic groups most similar to Immigrants are Korean (1.2%, a difference of 0.080%), Immigrants from Romania (1.2%, a difference of 0.090%), Immigrants from France (1.2%, a difference of 0.090%), Immigrants from Serbia (1.2%, a difference of 0.090%), and Immigrants from Eastern Europe (1.2%, a difference of 0.16%).
| Demographics | Rating | Rank | Disability Age Under 5 |
| Aleuts | 90.7 /100 | #122 | Exceptional 1.2% |
| Zimbabweans | 90.6 /100 | #123 | Exceptional 1.2% |
| Immigrants | Cambodia | 90.5 /100 | #124 | Exceptional 1.2% |
| Japanese | 90.3 /100 | #125 | Exceptional 1.2% |
| Central Americans | 89.7 /100 | #126 | Excellent 1.2% |
| Immigrants | Romania | 88.4 /100 | #127 | Excellent 1.2% |
| Immigrants | France | 88.4 /100 | #128 | Excellent 1.2% |
| Immigrants | Immigrants | 88.0 /100 | #129 | Excellent 1.2% |
| Koreans | 87.7 /100 | #130 | Excellent 1.2% |
| Immigrants | Serbia | 87.6 /100 | #131 | Excellent 1.2% |
| Immigrants | Eastern Europe | 87.3 /100 | #132 | Excellent 1.2% |
| Immigrants | Spain | 86.5 /100 | #133 | Excellent 1.2% |
| Argentineans | 85.7 /100 | #134 | Excellent 1.2% |
| Fijians | 84.7 /100 | #135 | Excellent 1.2% |
| Moroccans | 83.6 /100 | #136 | Excellent 1.2% |