Costa Rican vs Immigrants Disability Age Under 5

COMPARE

Costa Rican
Race
Ancestry
AfghanAfricanAlaska NativeAlaskan AthabascanAlbanianAleutAlsatianAmericanApacheArabArapahoArgentineanArmenianAssyrian/Chaldean/SyriacAustralianAustrianBahamianBangladeshiBarbadianBasqueBelgianBelizeanBermudanBhutaneseBlackfeetBolivianBrazilianBritishBritish West IndianBulgarianBurmeseCajunCambodianCanadianCape VerdeanCarpatho RusynCelticCentral AmericanCentral American IndianCherokeeCheyenneChickasawChileanChineseChippewaChoctawColombianColvilleComancheCosta RicanCreeCreekCroatianCrowCubanCypriotCzechCzechoslovakianDanishDelawareDominicanDutchDutch West IndianEastern EuropeanEcuadorianEgyptianEnglishEstonianEthiopianEuropeanFijianFilipinoFinnishFrenchFrench American IndianFrench CanadianGermanGerman RussianGhanaianGreekGuamanian/ChamorroGuatemalanGuyaneseHaitianHmongHonduranHopiHoumaHungarianIcelanderIndian (Asian)IndonesianInupiatIranianIraqiIrishIroquoisIsraeliItalianJamaicanJapaneseJordanianKenyanKiowaKoreanLaotianLatvianLebaneseLiberianLithuanianLumbeeLuxembourgerMacedonianMalaysianMalteseMarshalleseMenomineeMexicanMexican American IndianMongolianMoroccanNative HawaiianNavajoNepaleseNew ZealanderNicaraguanNigerianNorthern EuropeanNorwegianOkinawanOsageOttawaPaiutePakistaniPalestinianPanamanianParaguayanPennsylvania GermanPeruvianPimaPolishPortuguesePotawatomiPuebloPuerto RicanPuget Sound SalishRomanianRussianSalvadoranSamoanScandinavianScotch-IrishScottishSeminoleSenegaleseSerbianShoshoneSierra LeoneanSiouxSlavicSlovakSloveneSomaliSouth AfricanSouth AmericanSouth American IndianSoviet UnionSpaniardSpanishSpanish AmericanSpanish American IndianSri LankanSubsaharan AfricanSudaneseSwedishSwissSyrianTaiwaneseThaiTlingit-HaidaTohono O'OdhamTonganTrinidadian and TobagonianTsimshianTurkishU.S. Virgin IslanderUgandanUkrainianUruguayanUteVenezuelanVietnameseWelshWest IndianYakamaYaquiYugoslavianYumanYup'ikZimbabwean
Immigration
NonimmigrantsAfghanistanAfricaAlbaniaArgentinaArmeniaAsiaAustraliaAustriaBahamasBangladeshBarbadosBelarusBelgiumBelizeBoliviaBosnia and HerzegovinaBrazilBulgariaBurma/MyanmarCabo VerdeCambodiaCameroonCanadaCaribbeanCentral AmericaChileChinaColombiaCongoCosta RicaCroatiaCubaCzechoslovakiaDenmarkDominicaDominican RepublicEastern AfricaEastern AsiaEastern EuropeEcuadorEgyptEl SalvadorEnglandEritreaEthiopiaEuropeFijiFranceGermanyGhanaGreeceGrenadaGuatemalaGuyanaHaitiHondurasHong KongHungaryIndiaIndonesiaIranIraqIrelandIsraelItalyJamaicaJapanJordanKazakhstanKenyaKoreaKuwaitLaosLatin AmericaLatviaLebanonLiberiaLithuaniaMalaysiaMexicoMicronesiaMiddle AfricaMoldovaMoroccoNepalNetherlandsNicaraguaNigeriaNorth AmericaNorth MacedoniaNorthern AfricaNorthern EuropeNorwayOceaniaPakistanPanamaPeruPhilippinesPolandPortugalRomaniaRussiaSaudi ArabiaScotlandSenegalSerbiaSierra LeoneSingaporeSomaliaSouth AfricaSouth AmericaSouth Central AsiaSouth Eastern AsiaSouthern EuropeSpainSri LankaSt. Vincent and the GrenadinesSudanSwedenSwitzerlandSyriaTaiwanThailandTrinidad and TobagoTurkeyUgandaUkraineUruguayUzbekistanVenezuelaVietnamWest IndiesWestern AfricaWestern AsiaWestern EuropeYemenZaireZimbabweAzores
Immigrants
Race
Ancestry
AfghanAfricanAlaska NativeAlaskan AthabascanAlbanianAleutAlsatianAmericanApacheArabArapahoArgentineanArmenianAssyrian/Chaldean/SyriacAustralianAustrianBahamianBangladeshiBarbadianBasqueBelgianBelizeanBermudanBhutaneseBlackfeetBolivianBrazilianBritishBritish West IndianBulgarianBurmeseCajunCambodianCanadianCape VerdeanCarpatho RusynCelticCentral AmericanCentral American IndianCherokeeCheyenneChickasawChileanChineseChippewaChoctawColombianColvilleComancheCreeCreekCroatianCrowCubanCypriotCzechCzechoslovakianDanishDelawareDominicanDutchDutch West IndianEastern EuropeanEcuadorianEgyptianEnglishEstonianEthiopianEuropeanFijianFilipinoFinnishFrenchFrench American IndianFrench CanadianGermanGerman RussianGhanaianGreekGuamanian/ChamorroGuatemalanGuyaneseHaitianHmongHonduranHopiHoumaHungarianIcelanderIndian (Asian)IndonesianInupiatIranianIraqiIrishIroquoisIsraeliItalianJamaicanJapaneseJordanianKenyanKiowaKoreanLaotianLatvianLebaneseLiberianLithuanianLumbeeLuxembourgerMacedonianMalaysianMalteseMarshalleseMenomineeMexicanMexican American IndianMongolianMoroccanNative HawaiianNavajoNepaleseNew ZealanderNicaraguanNigerianNorthern EuropeanNorwegianOkinawanOsageOttawaPaiutePakistaniPalestinianPanamanianParaguayanPennsylvania GermanPeruvianPimaPolishPortuguesePotawatomiPuebloPuerto RicanPuget Sound SalishRomanianRussianSalvadoranSamoanScandinavianScotch-IrishScottishSeminoleSenegaleseSerbianShoshoneSierra LeoneanSiouxSlavicSlovakSloveneSomaliSouth AfricanSouth AmericanSouth American IndianSoviet UnionSpaniardSpanishSpanish AmericanSpanish American IndianSri LankanSubsaharan AfricanSudaneseSwedishSwissSyrianTaiwaneseThaiTlingit-HaidaTohono O'OdhamTonganTrinidadian and TobagonianTsimshianTurkishU.S. Virgin IslanderUgandanUkrainianUruguayanUteVenezuelanVietnameseWelshWest IndianYakamaYaquiYugoslavianYumanYup'ikZimbabwean
Immigration
NonimmigrantsImmigrantsAfghanistanAfricaAlbaniaArgentinaArmeniaAsiaAustraliaAustriaBahamasBangladeshBarbadosBelarusBelgiumBelizeBoliviaBosnia and HerzegovinaBrazilBulgariaBurma/MyanmarCabo VerdeCambodiaCameroonCanadaCaribbeanCentral AmericaChileChinaColombiaCongoCosta RicaCroatiaCubaCzechoslovakiaDenmarkDominicaDominican RepublicEastern AfricaEastern AsiaEastern EuropeEcuadorEgyptEl SalvadorEnglandEritreaEthiopiaEuropeFijiFranceGermanyGhanaGreeceGrenadaGuatemalaGuyanaHaitiHondurasHong KongHungaryIndiaIndonesiaIranIraqIrelandIsraelItalyJamaicaJapanJordanKazakhstanKenyaKoreaKuwaitLaosLatin AmericaLatviaLebanonLiberiaLithuaniaMalaysiaMexicoMicronesiaMiddle AfricaMoldovaMoroccoNepalNetherlandsNicaraguaNigeriaNorth AmericaNorth MacedoniaNorthern AfricaNorthern EuropeNorwayOceaniaPakistanPanamaPeruPhilippinesPolandPortugalRomaniaRussiaSaudi ArabiaScotlandSenegalSerbiaSierra LeoneSingaporeSomaliaSouth AfricaSouth AmericaSouth Central AsiaSouth Eastern AsiaSouthern EuropeSpainSri LankaSt. Vincent and the GrenadinesSudanSwedenSwitzerlandSyriaTaiwanThailandTrinidad and TobagoTurkeyUgandaUkraineUruguayUzbekistanVenezuelaVietnamWest IndiesWestern AfricaWestern AsiaWestern EuropeYemenZaireZimbabweAzores
Disability Age Under 5
Income
Poverty
Unemployment
Labor Participation
Family Structure
Vehicle Availability
Education Level
Disability

Disability Age Under 5 Comparison

Costa Ricans

Immigrants

Tragic
Excellent
1.4%
DISABILITY AGE UNDER 5
0.3/ 100
METRIC RATING
258th/ 347
METRIC RANK
1.2%
DISABILITY AGE UNDER 5
88.0/ 100
METRIC RATING
129th/ 347
METRIC RANK

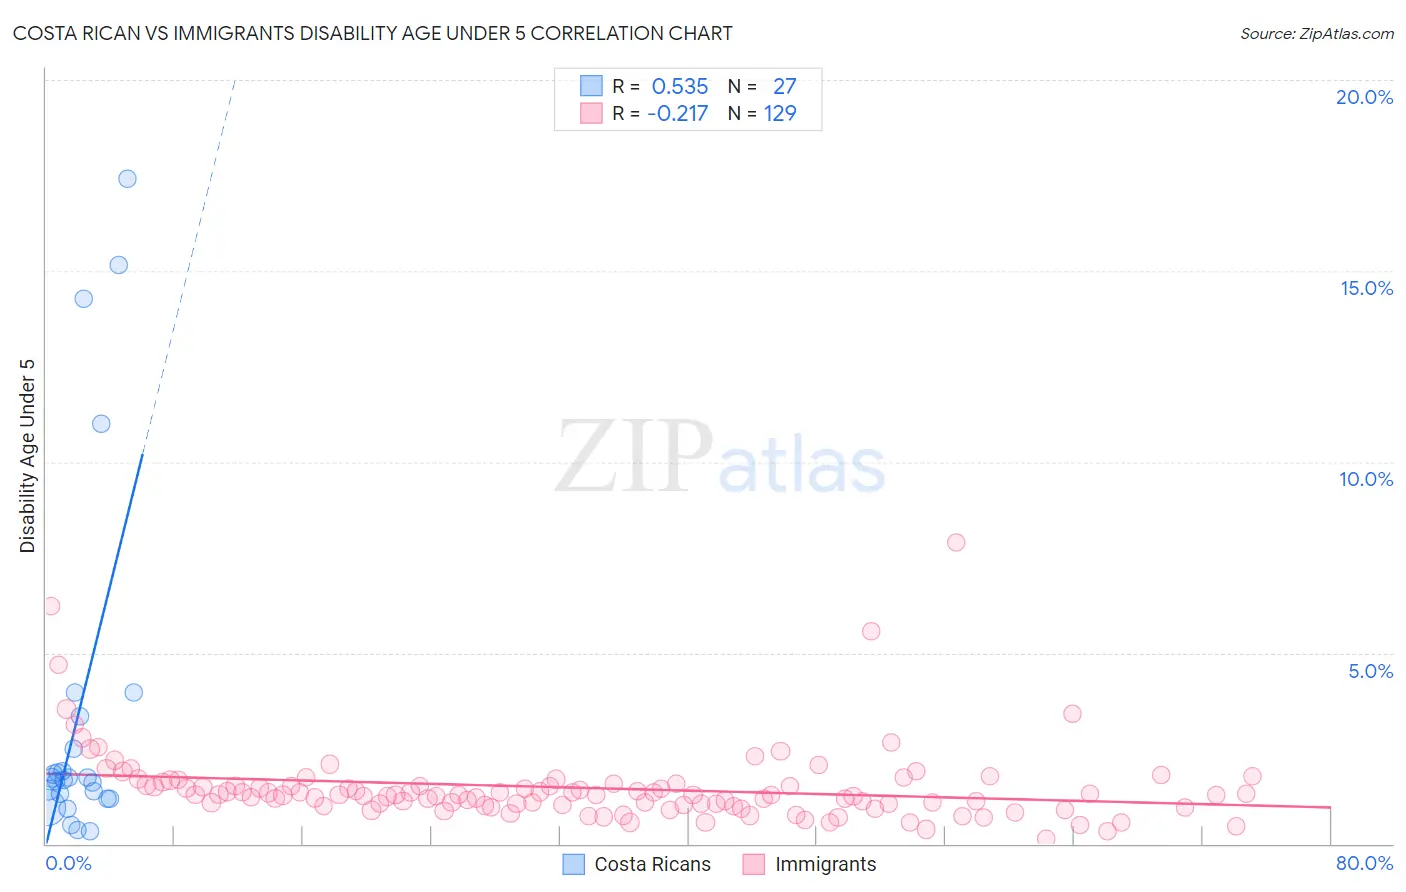
Costa Rican vs Immigrants Disability Age Under 5 Correlation Chart

The statistical analysis conducted on geographies consisting of 157,524,003 people shows a substantial positive correlation between the proportion of Costa Ricans and percentage of population with a disability under the age of 5 in the United States with a correlation coefficient (R) of 0.535 and weighted average of 1.4%. Similarly, the statistical analysis conducted on geographies consisting of 262,190,696 people shows a weak negative correlation between the proportion of Immigrants and percentage of population with a disability under the age of 5 in the United States with a correlation coefficient (R) of -0.217 and weighted average of 1.2%, a difference of 18.4%.
Costa Rican vs Immigrants Disability Age Under 5

Disability Age Under 5 Correlation Summary

MeasurementCosta RicanImmigrants
Minimum0.32%0.14%
Maximum17.4%7.9%
Range17.1%7.8%
Mean3.6%1.5%
Median1.7%1.3%
Interquartile 25% (IQ1)1.2%1.0%
Interquartile 75% (IQ3)3.4%1.5%
Interquartile Range (IQR)2.2%0.54%
Standard Deviation (Sample)4.8%1.0%
Standard Deviation (Population)4.7%1.0%

Similar Demographics by Disability Age Under 5

Demographics Similar to Costa Ricans by Disability Age Under 5

In terms of disability age under 5, the demographic groups most similar to Costa Ricans are Immigrants from Southern Europe (1.4%, a difference of 0.16%), Slovene (1.4%, a difference of 0.19%), Slavic (1.4%, a difference of 0.37%), Immigrants from Netherlands (1.4%, a difference of 1.0%), and Immigrants from Western Europe (1.4%, a difference of 1.1%).
DemographicsRating | RankDisability Age Under 5
Immigrants | Hungary
1.0
/100
|
#251
Tragic
1.4%
Immigrants | Scotland
0.9
/100
|
#252
Tragic
1.4%
Australians
0.7
/100
|
#253
Tragic
1.4%
Immigrants | Brazil
0.7
/100
|
#254
Tragic
1.4%
Immigrants | Liberia
0.6
/100
|
#255
Tragic
1.4%
Immigrants | Western Europe
0.5
/100
|
#256
Tragic
1.4%
Slovenes
0.3
/100
|
#257
Tragic
1.4%
Costa Ricans
0.3
/100
|
#258
Tragic
1.4%
Immigrants | Southern Europe
0.3
/100
|
#259
Tragic
1.4%
Slavs
0.3
/100
|
#260
Tragic
1.4%
Immigrants | Netherlands
0.2
/100
|
#261
Tragic
1.4%
Immigrants | Dominica
0.2
/100
|
#262
Tragic
1.4%
Spanish
0.2
/100
|
#263
Tragic
1.4%
Yugoslavians
0.1
/100
|
#264
Tragic
1.4%
Carpatho Rusyns
0.1
/100
|
#265
Tragic
1.4%

Demographics Similar to Immigrants by Disability Age Under 5

In terms of disability age under 5, the demographic groups most similar to Immigrants are Korean (1.2%, a difference of 0.080%), Immigrants from Romania (1.2%, a difference of 0.090%), Immigrants from France (1.2%, a difference of 0.090%), Immigrants from Serbia (1.2%, a difference of 0.090%), and Immigrants from Eastern Europe (1.2%, a difference of 0.16%).
DemographicsRating | RankDisability Age Under 5
Aleuts
90.7
/100
|
#122
Exceptional
1.2%
Zimbabweans
90.6
/100
|
#123
Exceptional
1.2%
Immigrants | Cambodia
90.5
/100
|
#124
Exceptional
1.2%
Japanese
90.3
/100
|
#125
Exceptional
1.2%
Central Americans
89.7
/100
|
#126
Excellent
1.2%
Immigrants | Romania
88.4
/100
|
#127
Excellent
1.2%
Immigrants | France
88.4
/100
|
#128
Excellent
1.2%
Immigrants | Immigrants
88.0
/100
|
#129
Excellent
1.2%
Koreans
87.7
/100
|
#130
Excellent
1.2%
Immigrants | Serbia
87.6
/100
|
#131
Excellent
1.2%
Immigrants | Eastern Europe
87.3
/100
|
#132
Excellent
1.2%
Immigrants | Spain
86.5
/100
|
#133
Excellent
1.2%
Argentineans
85.7
/100
|
#134
Excellent
1.2%
Fijians
84.7
/100
|
#135
Excellent
1.2%
Moroccans
83.6
/100
|
#136
Excellent
1.2%