Immigrants from Trinidad and Tobago vs Belgian Unemployment Among Women with Children Ages 6 to 17 years
COMPARE
Immigrants from Trinidad and Tobago
Belgian
Unemployment Among Women with Children Ages 6 to 17 years
Unemployment Among Women with Children Ages 6 to 17 years Comparison
Immigrants from Trinidad and Tobago
Belgians
9.1%
UNEMPLOYMENT AMONG WOMEN WITH CHILDREN AGES 6 TO 17 YEARS
16.7/ 100
METRIC RATING
201st/ 347
METRIC RANK
9.2%
UNEMPLOYMENT AMONG WOMEN WITH CHILDREN AGES 6 TO 17 YEARS
6.4/ 100
METRIC RATING
220th/ 347
METRIC RANK
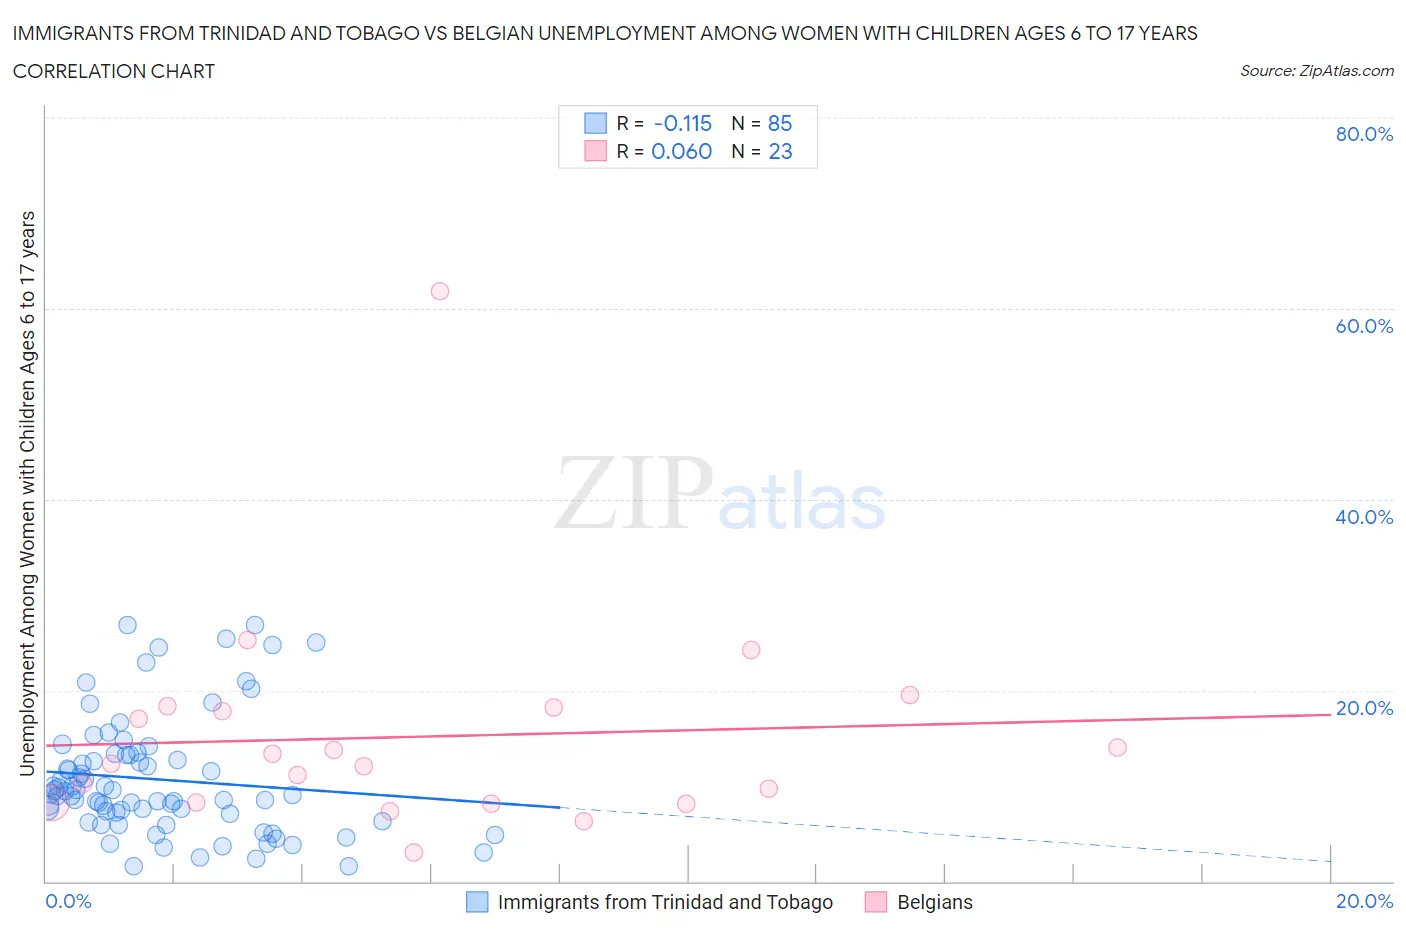
Immigrants from Trinidad and Tobago vs Belgian Unemployment Among Women with Children Ages 6 to 17 years Correlation Chart
The statistical analysis conducted on geographies consisting of 179,476,892 people shows a poor negative correlation between the proportion of Immigrants from Trinidad and Tobago and unemployment rate among women with children between the ages 6 and 17 in the United States with a correlation coefficient (R) of -0.115 and weighted average of 9.1%. Similarly, the statistical analysis conducted on geographies consisting of 250,038,344 people shows a slight positive correlation between the proportion of Belgians and unemployment rate among women with children between the ages 6 and 17 in the United States with a correlation coefficient (R) of 0.060 and weighted average of 9.2%, a difference of 1.2%.
Unemployment Among Women with Children Ages 6 to 17 years Correlation Summary
| Measurement | Immigrants from Trinidad and Tobago | Belgian |
| Minimum | 1.6% | 3.0% |
| Maximum | 26.8% | 61.8% |
| Range | 25.2% | 58.8% |
| Mean | 10.7% | 15.1% |
| Median | 9.1% | 12.3% |
| Interquartile 25% (IQ1) | 6.7% | 8.2% |
| Interquartile 75% (IQ3) | 13.2% | 18.2% |
| Interquartile Range (IQR) | 6.5% | 9.9% |
| Standard Deviation (Sample) | 6.1% | 11.6% |
| Standard Deviation (Population) | 6.1% | 11.4% |
Demographics Similar to Immigrants from Trinidad and Tobago and Belgians by Unemployment Among Women with Children Ages 6 to 17 years
In terms of unemployment among women with children ages 6 to 17 years, the demographic groups most similar to Immigrants from Trinidad and Tobago are Immigrants from Middle Africa (9.1%, a difference of 0.090%), Trinidadian and Tobagonian (9.1%, a difference of 0.11%), Maltese (9.1%, a difference of 0.11%), Immigrants from Canada (9.1%, a difference of 0.12%), and Immigrants from Western Europe (9.1%, a difference of 0.22%). Similarly, the demographic groups most similar to Belgians are Immigrants from Scotland (9.2%, a difference of 0.030%), Syrian (9.2%, a difference of 0.080%), German (9.2%, a difference of 0.12%), Immigrants from Germany (9.2%, a difference of 0.14%), and Immigrants from Uruguay (9.2%, a difference of 0.14%).
| Demographics | Rating | Rank | Unemployment Among Women with Children Ages 6 to 17 years |
| Trinidadians and Tobagonians | 18.2 /100 | #200 | Poor 9.1% |
| Immigrants | Trinidad and Tobago | 16.7 /100 | #201 | Poor 9.1% |
| Immigrants | Middle Africa | 15.6 /100 | #202 | Poor 9.1% |
| Maltese | 15.3 /100 | #203 | Poor 9.1% |
| Immigrants | Canada | 15.3 /100 | #204 | Poor 9.1% |
| Immigrants | Western Europe | 14.1 /100 | #205 | Poor 9.1% |
| Immigrants | North America | 12.7 /100 | #206 | Poor 9.2% |
| Cubans | 10.9 /100 | #207 | Poor 9.2% |
| Immigrants | Peru | 10.8 /100 | #208 | Poor 9.2% |
| Salvadorans | 10.7 /100 | #209 | Poor 9.2% |
| Finns | 10.0 /100 | #210 | Tragic 9.2% |
| Immigrants | Cuba | 9.6 /100 | #211 | Tragic 9.2% |
| Peruvians | 9.0 /100 | #212 | Tragic 9.2% |
| Spaniards | 8.2 /100 | #213 | Tragic 9.2% |
| Iroquois | 7.5 /100 | #214 | Tragic 9.2% |
| Immigrants | Germany | 7.2 /100 | #215 | Tragic 9.2% |
| Immigrants | Uruguay | 7.2 /100 | #216 | Tragic 9.2% |
| Germans | 7.2 /100 | #217 | Tragic 9.2% |
| Syrians | 6.9 /100 | #218 | Tragic 9.2% |
| Immigrants | Scotland | 6.6 /100 | #219 | Tragic 9.2% |
| Belgians | 6.4 /100 | #220 | Tragic 9.2% |