Immigrants from Thailand vs English Female Disability
COMPARE
Immigrants from Thailand
English
Female Disability
Female Disability Comparison
Immigrants from Thailand
English
12.4%
FEMALE DISABILITY
14.5/ 100
METRIC RATING
213th/ 347
METRIC RANK
13.1%
FEMALE DISABILITY
0.0/ 100
METRIC RATING
283rd/ 347
METRIC RANK
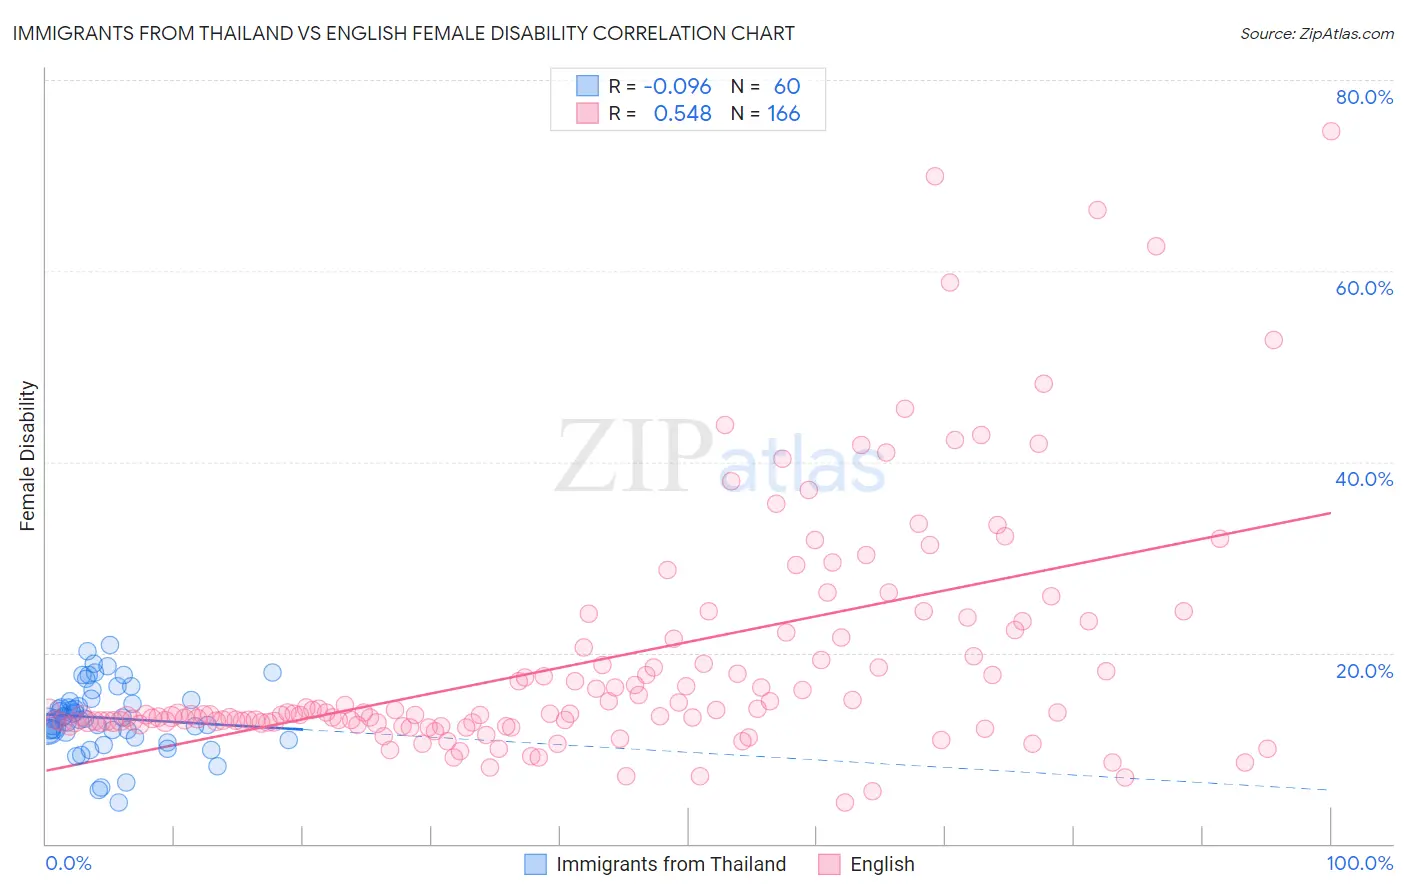
Immigrants from Thailand vs English Female Disability Correlation Chart
The statistical analysis conducted on geographies consisting of 316,982,742 people shows a slight negative correlation between the proportion of Immigrants from Thailand and percentage of females with a disability in the United States with a correlation coefficient (R) of -0.096 and weighted average of 12.4%. Similarly, the statistical analysis conducted on geographies consisting of 579,455,511 people shows a substantial positive correlation between the proportion of English and percentage of females with a disability in the United States with a correlation coefficient (R) of 0.548 and weighted average of 13.1%, a difference of 5.4%.
Female Disability Correlation Summary
| Measurement | Immigrants from Thailand | English |
| Minimum | 4.3% | 4.3% |
| Maximum | 20.8% | 74.6% |
| Range | 16.5% | 70.3% |
| Mean | 13.2% | 19.1% |
| Median | 13.1% | 13.6% |
| Interquartile 25% (IQ1) | 11.7% | 12.7% |
| Interquartile 75% (IQ3) | 15.0% | 21.5% |
| Interquartile Range (IQR) | 3.3% | 8.8% |
| Standard Deviation (Sample) | 3.5% | 12.5% |
| Standard Deviation (Population) | 3.4% | 12.5% |
Similar Demographics by Female Disability
Demographics Similar to Immigrants from Thailand by Female Disability
In terms of female disability, the demographic groups most similar to Immigrants from Thailand are Ute (12.4%, a difference of 0.020%), Swiss (12.4%, a difference of 0.030%), Immigrants from Bosnia and Herzegovina (12.4%, a difference of 0.030%), Panamanian (12.4%, a difference of 0.080%), and Samoan (12.4%, a difference of 0.080%).
| Demographics | Rating | Rank | Female Disability |
| Immigrants | Cuba | 20.2 /100 | #206 | Fair 12.4% |
| Croatians | 20.2 /100 | #207 | Fair 12.4% |
| Basques | 17.5 /100 | #208 | Poor 12.4% |
| Mexicans | 15.7 /100 | #209 | Poor 12.4% |
| Swiss | 14.9 /100 | #210 | Poor 12.4% |
| Immigrants | Bosnia and Herzegovina | 14.8 /100 | #211 | Poor 12.4% |
| Ute | 14.7 /100 | #212 | Poor 12.4% |
| Immigrants | Thailand | 14.5 /100 | #213 | Poor 12.4% |
| Panamanians | 13.5 /100 | #214 | Poor 12.4% |
| Samoans | 13.4 /100 | #215 | Poor 12.4% |
| Immigrants | Burma/Myanmar | 13.3 /100 | #216 | Poor 12.4% |
| British | 12.7 /100 | #217 | Poor 12.4% |
| Immigrants | Bahamas | 12.5 /100 | #218 | Poor 12.4% |
| Europeans | 12.1 /100 | #219 | Poor 12.4% |
| Bahamians | 11.1 /100 | #220 | Poor 12.4% |
Demographics Similar to English by Female Disability
In terms of female disability, the demographic groups most similar to English are Welsh (13.1%, a difference of 0.0%), U.S. Virgin Islander (13.1%, a difference of 0.080%), Irish (13.1%, a difference of 0.12%), Hmong (13.1%, a difference of 0.13%), and Bangladeshi (13.1%, a difference of 0.18%).
| Demographics | Rating | Rank | Female Disability |
| Immigrants | Dominica | 0.1 /100 | #276 | Tragic 13.0% |
| Spanish | 0.1 /100 | #277 | Tragic 13.0% |
| Scottish | 0.1 /100 | #278 | Tragic 13.0% |
| Arapaho | 0.1 /100 | #279 | Tragic 13.0% |
| Irish | 0.1 /100 | #280 | Tragic 13.1% |
| U.S. Virgin Islanders | 0.1 /100 | #281 | Tragic 13.1% |
| Welsh | 0.0 /100 | #282 | Tragic 13.1% |
| English | 0.0 /100 | #283 | Tragic 13.1% |
| Hmong | 0.0 /100 | #284 | Tragic 13.1% |
| Bangladeshis | 0.0 /100 | #285 | Tragic 13.1% |
| Fijians | 0.0 /100 | #286 | Tragic 13.1% |
| Yaqui | 0.0 /100 | #287 | Tragic 13.2% |
| Whites/Caucasians | 0.0 /100 | #288 | Tragic 13.2% |
| Tlingit-Haida | 0.0 /100 | #289 | Tragic 13.2% |
| Immigrants | Yemen | 0.0 /100 | #290 | Tragic 13.2% |