Immigrants from Thailand vs American Vision Disability
COMPARE
Immigrants from Thailand
American
Vision Disability
Vision Disability Comparison
Immigrants from Thailand
Americans
2.2%
VISION DISABILITY
20.1/ 100
METRIC RATING
200th/ 347
METRIC RANK
2.6%
VISION DISABILITY
0.0/ 100
METRIC RATING
312th/ 347
METRIC RANK
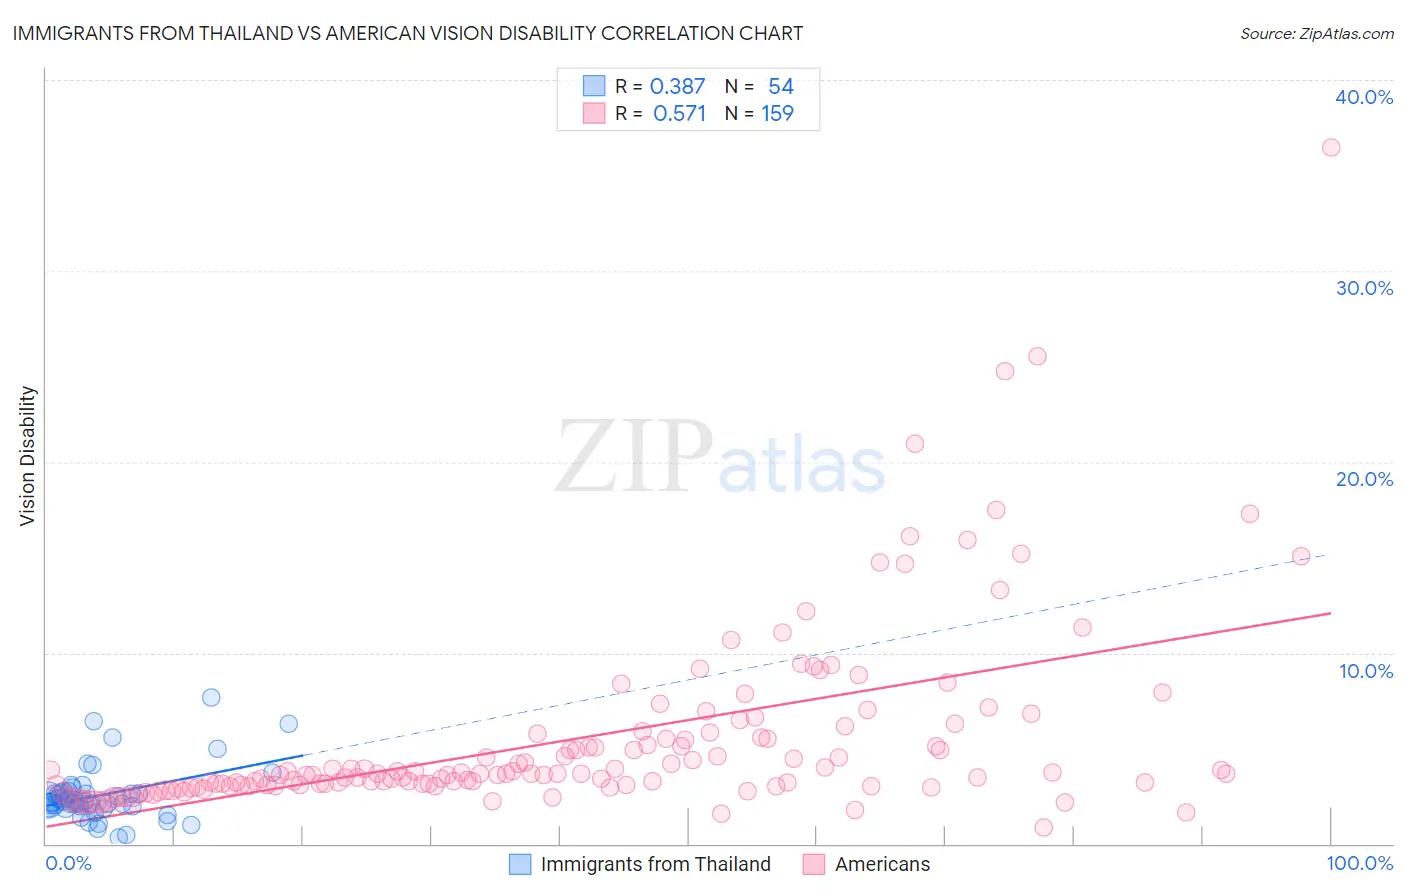
Immigrants from Thailand vs American Vision Disability Correlation Chart
The statistical analysis conducted on geographies consisting of 316,876,708 people shows a mild positive correlation between the proportion of Immigrants from Thailand and percentage of population with vision disability in the United States with a correlation coefficient (R) of 0.387 and weighted average of 2.2%. Similarly, the statistical analysis conducted on geographies consisting of 579,371,310 people shows a substantial positive correlation between the proportion of Americans and percentage of population with vision disability in the United States with a correlation coefficient (R) of 0.571 and weighted average of 2.6%, a difference of 19.7%.
Vision Disability Correlation Summary
| Measurement | Immigrants from Thailand | American |
| Minimum | 0.34% | 0.84% |
| Maximum | 7.7% | 36.4% |
| Range | 7.3% | 35.6% |
| Mean | 2.5% | 5.5% |
| Median | 2.2% | 3.7% |
| Interquartile 25% (IQ1) | 2.0% | 3.1% |
| Interquartile 75% (IQ3) | 2.7% | 5.6% |
| Interquartile Range (IQR) | 0.75% | 2.5% |
| Standard Deviation (Sample) | 1.4% | 4.9% |
| Standard Deviation (Population) | 1.4% | 4.9% |
Similar Demographics by Vision Disability
Demographics Similar to Immigrants from Thailand by Vision Disability
In terms of vision disability, the demographic groups most similar to Immigrants from Thailand are Immigrants from El Salvador (2.2%, a difference of 0.090%), Slovak (2.2%, a difference of 0.13%), Czechoslovakian (2.2%, a difference of 0.14%), Ghanaian (2.2%, a difference of 0.16%), and Immigrants from Zaire (2.2%, a difference of 0.22%).
| Demographics | Rating | Rank | Vision Disability |
| British | 25.1 /100 | #193 | Fair 2.2% |
| Immigrants | Barbados | 24.0 /100 | #194 | Fair 2.2% |
| Immigrants | Immigrants | 23.7 /100 | #195 | Fair 2.2% |
| Immigrants | Grenada | 23.1 /100 | #196 | Fair 2.2% |
| Ghanaians | 21.8 /100 | #197 | Fair 2.2% |
| Czechoslovakians | 21.6 /100 | #198 | Fair 2.2% |
| Immigrants | El Salvador | 21.0 /100 | #199 | Fair 2.2% |
| Immigrants | Thailand | 20.1 /100 | #200 | Fair 2.2% |
| Slovaks | 18.8 /100 | #201 | Poor 2.2% |
| Immigrants | Zaire | 18.0 /100 | #202 | Poor 2.2% |
| Dutch | 17.1 /100 | #203 | Poor 2.2% |
| Immigrants | Guyana | 15.9 /100 | #204 | Poor 2.2% |
| Samoans | 15.7 /100 | #205 | Poor 2.2% |
| Pennsylvania Germans | 14.5 /100 | #206 | Poor 2.2% |
| Immigrants | Nigeria | 13.5 /100 | #207 | Poor 2.2% |
Demographics Similar to Americans by Vision Disability
In terms of vision disability, the demographic groups most similar to Americans are Potawatomi (2.6%, a difference of 0.010%), Inupiat (2.7%, a difference of 0.080%), Dominican (2.6%, a difference of 0.83%), Blackfeet (2.6%, a difference of 0.87%), and Immigrants from Yemen (2.6%, a difference of 1.2%).
| Demographics | Rating | Rank | Vision Disability |
| Hispanics or Latinos | 0.0 /100 | #305 | Tragic 2.6% |
| Iroquois | 0.0 /100 | #306 | Tragic 2.6% |
| Immigrants | Dominican Republic | 0.0 /100 | #307 | Tragic 2.6% |
| Arapaho | 0.0 /100 | #308 | Tragic 2.6% |
| Immigrants | Yemen | 0.0 /100 | #309 | Tragic 2.6% |
| Blackfeet | 0.0 /100 | #310 | Tragic 2.6% |
| Dominicans | 0.0 /100 | #311 | Tragic 2.6% |
| Americans | 0.0 /100 | #312 | Tragic 2.6% |
| Potawatomi | 0.0 /100 | #313 | Tragic 2.6% |
| Inupiat | 0.0 /100 | #314 | Tragic 2.7% |
| Osage | 0.0 /100 | #315 | Tragic 2.7% |
| Shoshone | 0.0 /100 | #316 | Tragic 2.7% |
| Yup'ik | 0.0 /100 | #317 | Tragic 2.7% |
| Alaska Natives | 0.0 /100 | #318 | Tragic 2.7% |
| Tohono O'odham | 0.0 /100 | #319 | Tragic 2.8% |