Immigrants from Kazakhstan vs American Vision Disability
COMPARE
Immigrants from Kazakhstan
American
Vision Disability
Vision Disability Comparison
Immigrants from Kazakhstan
Americans
2.0%
VISION DISABILITY
98.6/ 100
METRIC RATING
70th/ 347
METRIC RANK
2.6%
VISION DISABILITY
0.0/ 100
METRIC RATING
312th/ 347
METRIC RANK
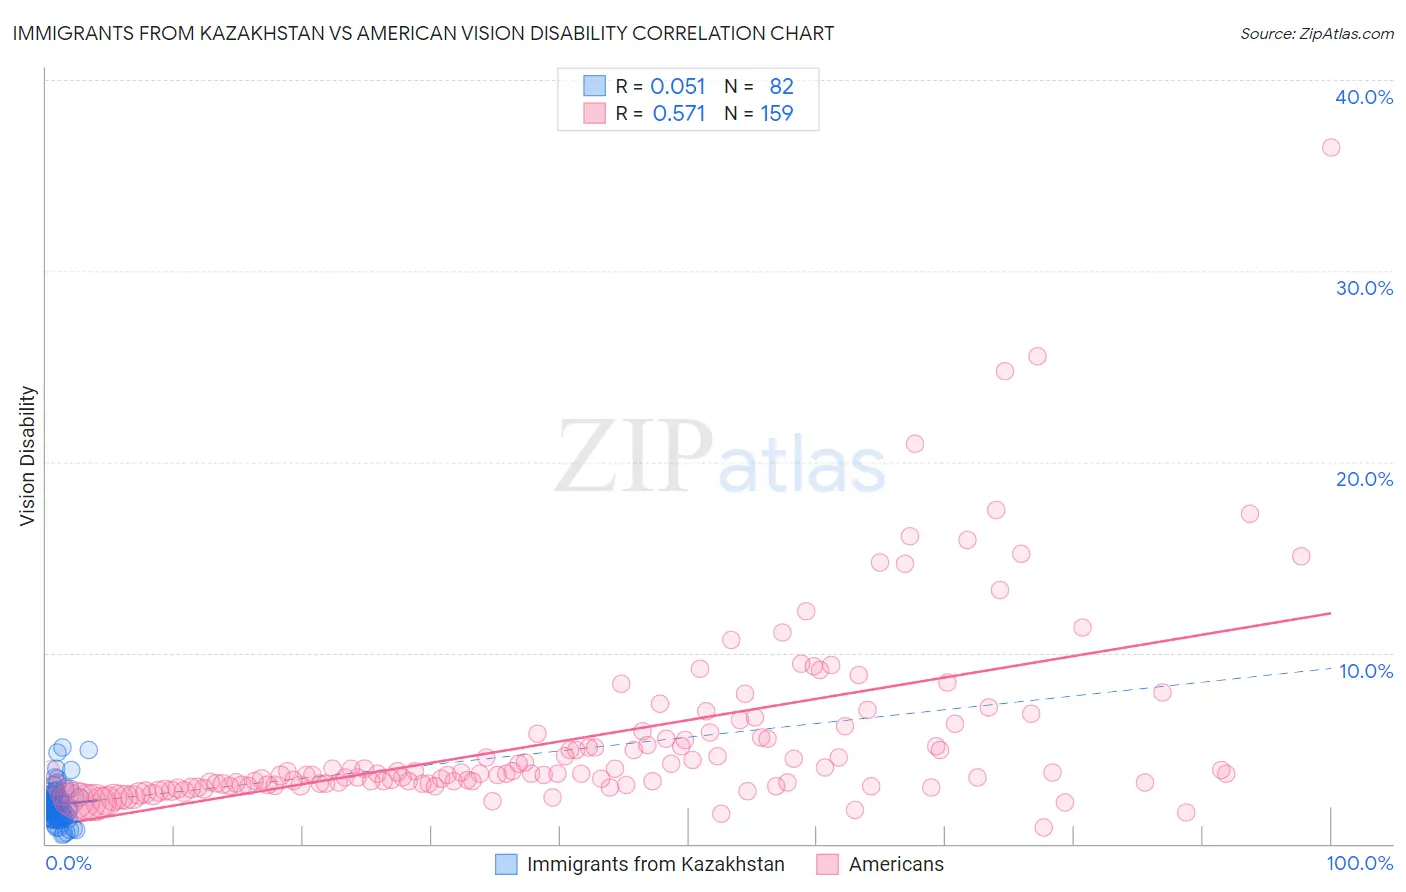
Immigrants from Kazakhstan vs American Vision Disability Correlation Chart
The statistical analysis conducted on geographies consisting of 124,421,317 people shows a slight positive correlation between the proportion of Immigrants from Kazakhstan and percentage of population with vision disability in the United States with a correlation coefficient (R) of 0.051 and weighted average of 2.0%. Similarly, the statistical analysis conducted on geographies consisting of 579,371,310 people shows a substantial positive correlation between the proportion of Americans and percentage of population with vision disability in the United States with a correlation coefficient (R) of 0.571 and weighted average of 2.6%, a difference of 31.0%.
Vision Disability Correlation Summary
| Measurement | Immigrants from Kazakhstan | American |
| Minimum | 0.47% | 0.84% |
| Maximum | 5.1% | 36.4% |
| Range | 4.6% | 35.6% |
| Mean | 2.0% | 5.5% |
| Median | 1.9% | 3.7% |
| Interquartile 25% (IQ1) | 1.5% | 3.1% |
| Interquartile 75% (IQ3) | 2.3% | 5.6% |
| Interquartile Range (IQR) | 0.85% | 2.5% |
| Standard Deviation (Sample) | 0.91% | 4.9% |
| Standard Deviation (Population) | 0.90% | 4.9% |
Similar Demographics by Vision Disability
Demographics Similar to Immigrants from Kazakhstan by Vision Disability
In terms of vision disability, the demographic groups most similar to Immigrants from Kazakhstan are Immigrants from Northern Europe (2.0%, a difference of 0.010%), Russian (2.0%, a difference of 0.020%), Immigrants from France (2.0%, a difference of 0.060%), Immigrants from Czechoslovakia (2.0%, a difference of 0.19%), and Immigrants from Eritrea (2.0%, a difference of 0.26%).
| Demographics | Rating | Rank | Vision Disability |
| Armenians | 99.0 /100 | #63 | Exceptional 2.0% |
| Immigrants | Greece | 99.0 /100 | #64 | Exceptional 2.0% |
| Maltese | 98.9 /100 | #65 | Exceptional 2.0% |
| Immigrants | Argentina | 98.9 /100 | #66 | Exceptional 2.0% |
| Immigrants | Northern Africa | 98.8 /100 | #67 | Exceptional 2.0% |
| Immigrants | Czechoslovakia | 98.7 /100 | #68 | Exceptional 2.0% |
| Russians | 98.6 /100 | #69 | Exceptional 2.0% |
| Immigrants | Kazakhstan | 98.6 /100 | #70 | Exceptional 2.0% |
| Immigrants | Northern Europe | 98.6 /100 | #71 | Exceptional 2.0% |
| Immigrants | France | 98.5 /100 | #72 | Exceptional 2.0% |
| Immigrants | Eritrea | 98.4 /100 | #73 | Exceptional 2.0% |
| Palestinians | 98.3 /100 | #74 | Exceptional 2.0% |
| Immigrants | North Macedonia | 98.3 /100 | #75 | Exceptional 2.0% |
| Paraguayans | 98.3 /100 | #76 | Exceptional 2.0% |
| Immigrants | Jordan | 98.3 /100 | #77 | Exceptional 2.0% |
Demographics Similar to Americans by Vision Disability
In terms of vision disability, the demographic groups most similar to Americans are Potawatomi (2.6%, a difference of 0.010%), Inupiat (2.7%, a difference of 0.080%), Dominican (2.6%, a difference of 0.83%), Blackfeet (2.6%, a difference of 0.87%), and Immigrants from Yemen (2.6%, a difference of 1.2%).
| Demographics | Rating | Rank | Vision Disability |
| Hispanics or Latinos | 0.0 /100 | #305 | Tragic 2.6% |
| Iroquois | 0.0 /100 | #306 | Tragic 2.6% |
| Immigrants | Dominican Republic | 0.0 /100 | #307 | Tragic 2.6% |
| Arapaho | 0.0 /100 | #308 | Tragic 2.6% |
| Immigrants | Yemen | 0.0 /100 | #309 | Tragic 2.6% |
| Blackfeet | 0.0 /100 | #310 | Tragic 2.6% |
| Dominicans | 0.0 /100 | #311 | Tragic 2.6% |
| Americans | 0.0 /100 | #312 | Tragic 2.6% |
| Potawatomi | 0.0 /100 | #313 | Tragic 2.6% |
| Inupiat | 0.0 /100 | #314 | Tragic 2.7% |
| Osage | 0.0 /100 | #315 | Tragic 2.7% |
| Shoshone | 0.0 /100 | #316 | Tragic 2.7% |
| Yup'ik | 0.0 /100 | #317 | Tragic 2.7% |
| Alaska Natives | 0.0 /100 | #318 | Tragic 2.7% |
| Tohono O'odham | 0.0 /100 | #319 | Tragic 2.8% |