Immigrants from Bahamas vs American Vision Disability
COMPARE
Immigrants from Bahamas
American
Vision Disability
Vision Disability Comparison
Immigrants from Bahamas
Americans
2.4%
VISION DISABILITY
0.1/ 100
METRIC RATING
273rd/ 347
METRIC RANK
2.6%
VISION DISABILITY
0.0/ 100
METRIC RATING
312th/ 347
METRIC RANK
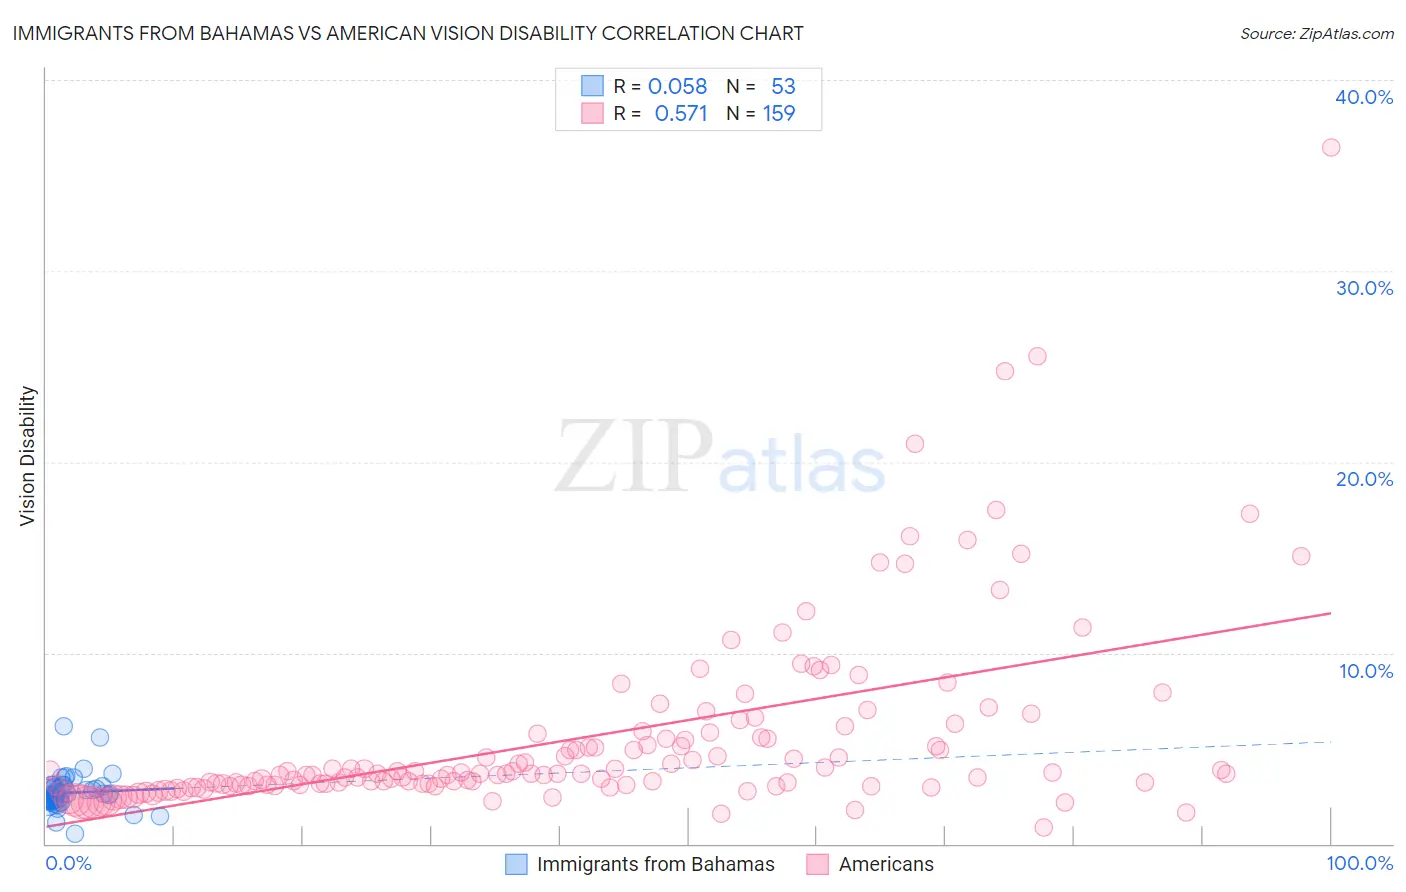
Immigrants from Bahamas vs American Vision Disability Correlation Chart
The statistical analysis conducted on geographies consisting of 104,644,216 people shows a slight positive correlation between the proportion of Immigrants from Bahamas and percentage of population with vision disability in the United States with a correlation coefficient (R) of 0.058 and weighted average of 2.4%. Similarly, the statistical analysis conducted on geographies consisting of 579,371,310 people shows a substantial positive correlation between the proportion of Americans and percentage of population with vision disability in the United States with a correlation coefficient (R) of 0.571 and weighted average of 2.6%, a difference of 9.3%.
Vision Disability Correlation Summary
| Measurement | Immigrants from Bahamas | American |
| Minimum | 0.51% | 0.84% |
| Maximum | 6.2% | 36.4% |
| Range | 5.7% | 35.6% |
| Mean | 2.7% | 5.5% |
| Median | 2.5% | 3.7% |
| Interquartile 25% (IQ1) | 2.3% | 3.1% |
| Interquartile 75% (IQ3) | 3.0% | 5.6% |
| Interquartile Range (IQR) | 0.70% | 2.5% |
| Standard Deviation (Sample) | 0.89% | 4.9% |
| Standard Deviation (Population) | 0.88% | 4.9% |
Similar Demographics by Vision Disability
Demographics Similar to Immigrants from Bahamas by Vision Disability
In terms of vision disability, the demographic groups most similar to Immigrants from Bahamas are Immigrants from Latin America (2.4%, a difference of 0.31%), Spaniard (2.4%, a difference of 0.33%), Immigrants from the Azores (2.4%, a difference of 0.43%), Cuban (2.4%, a difference of 0.59%), and Celtic (2.4%, a difference of 0.60%).
| Demographics | Rating | Rank | Vision Disability |
| Mexican American Indians | 0.1 /100 | #266 | Tragic 2.4% |
| Ute | 0.1 /100 | #267 | Tragic 2.4% |
| Senegalese | 0.1 /100 | #268 | Tragic 2.4% |
| Celtics | 0.1 /100 | #269 | Tragic 2.4% |
| Cubans | 0.1 /100 | #270 | Tragic 2.4% |
| Immigrants | Azores | 0.1 /100 | #271 | Tragic 2.4% |
| Spaniards | 0.1 /100 | #272 | Tragic 2.4% |
| Immigrants | Bahamas | 0.1 /100 | #273 | Tragic 2.4% |
| Immigrants | Latin America | 0.0 /100 | #274 | Tragic 2.4% |
| Chippewa | 0.0 /100 | #275 | Tragic 2.4% |
| Scotch-Irish | 0.0 /100 | #276 | Tragic 2.4% |
| Bahamians | 0.0 /100 | #277 | Tragic 2.4% |
| Spanish | 0.0 /100 | #278 | Tragic 2.4% |
| Nepalese | 0.0 /100 | #279 | Tragic 2.4% |
| Cape Verdeans | 0.0 /100 | #280 | Tragic 2.4% |
Demographics Similar to Americans by Vision Disability
In terms of vision disability, the demographic groups most similar to Americans are Potawatomi (2.6%, a difference of 0.010%), Inupiat (2.7%, a difference of 0.080%), Dominican (2.6%, a difference of 0.83%), Blackfeet (2.6%, a difference of 0.87%), and Immigrants from Yemen (2.6%, a difference of 1.2%).
| Demographics | Rating | Rank | Vision Disability |
| Hispanics or Latinos | 0.0 /100 | #305 | Tragic 2.6% |
| Iroquois | 0.0 /100 | #306 | Tragic 2.6% |
| Immigrants | Dominican Republic | 0.0 /100 | #307 | Tragic 2.6% |
| Arapaho | 0.0 /100 | #308 | Tragic 2.6% |
| Immigrants | Yemen | 0.0 /100 | #309 | Tragic 2.6% |
| Blackfeet | 0.0 /100 | #310 | Tragic 2.6% |
| Dominicans | 0.0 /100 | #311 | Tragic 2.6% |
| Americans | 0.0 /100 | #312 | Tragic 2.6% |
| Potawatomi | 0.0 /100 | #313 | Tragic 2.6% |
| Inupiat | 0.0 /100 | #314 | Tragic 2.7% |
| Osage | 0.0 /100 | #315 | Tragic 2.7% |
| Shoshone | 0.0 /100 | #316 | Tragic 2.7% |
| Yup'ik | 0.0 /100 | #317 | Tragic 2.7% |
| Alaska Natives | 0.0 /100 | #318 | Tragic 2.7% |
| Tohono O'odham | 0.0 /100 | #319 | Tragic 2.8% |