Immigrants from Thailand vs Immigrants from Argentina Vision Disability
COMPARE
Immigrants from Thailand
Immigrants from Argentina
Vision Disability
Vision Disability Comparison
Immigrants from Thailand
Immigrants from Argentina
2.2%
VISION DISABILITY
20.1/ 100
METRIC RATING
200th/ 347
METRIC RANK
2.0%
VISION DISABILITY
98.9/ 100
METRIC RATING
66th/ 347
METRIC RANK
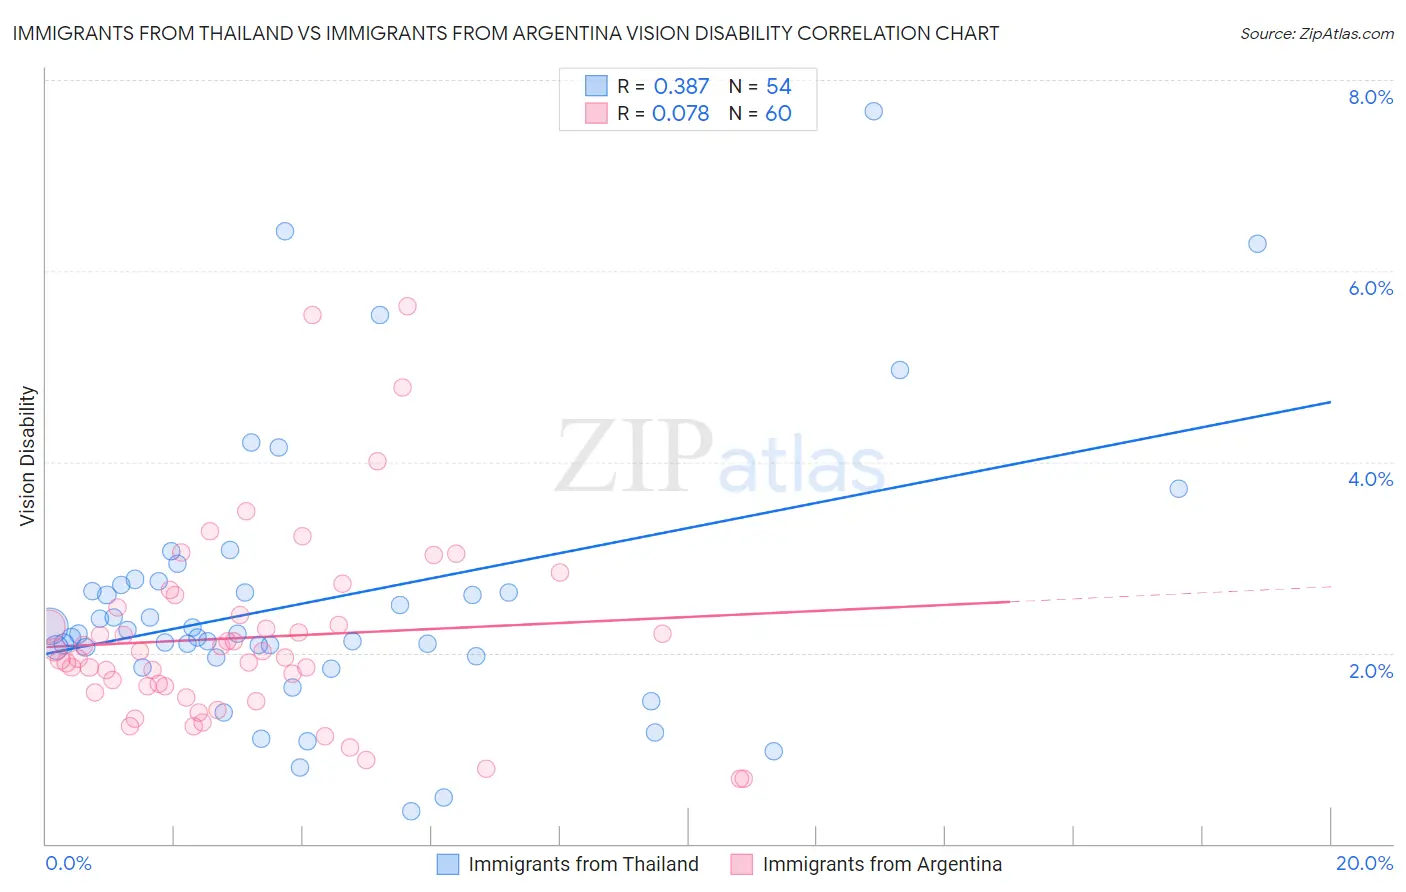
Immigrants from Thailand vs Immigrants from Argentina Vision Disability Correlation Chart
The statistical analysis conducted on geographies consisting of 316,876,708 people shows a mild positive correlation between the proportion of Immigrants from Thailand and percentage of population with vision disability in the United States with a correlation coefficient (R) of 0.387 and weighted average of 2.2%. Similarly, the statistical analysis conducted on geographies consisting of 264,359,612 people shows a slight positive correlation between the proportion of Immigrants from Argentina and percentage of population with vision disability in the United States with a correlation coefficient (R) of 0.078 and weighted average of 2.0%, a difference of 9.9%.
Vision Disability Correlation Summary
| Measurement | Immigrants from Thailand | Immigrants from Argentina |
| Minimum | 0.34% | 0.68% |
| Maximum | 7.7% | 5.6% |
| Range | 7.3% | 4.9% |
| Mean | 2.5% | 2.2% |
| Median | 2.2% | 2.0% |
| Interquartile 25% (IQ1) | 2.0% | 1.6% |
| Interquartile 75% (IQ3) | 2.7% | 2.4% |
| Interquartile Range (IQR) | 0.75% | 0.82% |
| Standard Deviation (Sample) | 1.4% | 1.0% |
| Standard Deviation (Population) | 1.4% | 0.99% |
Similar Demographics by Vision Disability
Demographics Similar to Immigrants from Thailand by Vision Disability
In terms of vision disability, the demographic groups most similar to Immigrants from Thailand are Immigrants from El Salvador (2.2%, a difference of 0.090%), Slovak (2.2%, a difference of 0.13%), Czechoslovakian (2.2%, a difference of 0.14%), Ghanaian (2.2%, a difference of 0.16%), and Immigrants from Zaire (2.2%, a difference of 0.22%).
| Demographics | Rating | Rank | Vision Disability |
| British | 25.1 /100 | #193 | Fair 2.2% |
| Immigrants | Barbados | 24.0 /100 | #194 | Fair 2.2% |
| Immigrants | Immigrants | 23.7 /100 | #195 | Fair 2.2% |
| Immigrants | Grenada | 23.1 /100 | #196 | Fair 2.2% |
| Ghanaians | 21.8 /100 | #197 | Fair 2.2% |
| Czechoslovakians | 21.6 /100 | #198 | Fair 2.2% |
| Immigrants | El Salvador | 21.0 /100 | #199 | Fair 2.2% |
| Immigrants | Thailand | 20.1 /100 | #200 | Fair 2.2% |
| Slovaks | 18.8 /100 | #201 | Poor 2.2% |
| Immigrants | Zaire | 18.0 /100 | #202 | Poor 2.2% |
| Dutch | 17.1 /100 | #203 | Poor 2.2% |
| Immigrants | Guyana | 15.9 /100 | #204 | Poor 2.2% |
| Samoans | 15.7 /100 | #205 | Poor 2.2% |
| Pennsylvania Germans | 14.5 /100 | #206 | Poor 2.2% |
| Immigrants | Nigeria | 13.5 /100 | #207 | Poor 2.2% |
Demographics Similar to Immigrants from Argentina by Vision Disability
In terms of vision disability, the demographic groups most similar to Immigrants from Argentina are Maltese (2.0%, a difference of 0.060%), Immigrants from Northern Africa (2.0%, a difference of 0.11%), Immigrants from Greece (2.0%, a difference of 0.13%), Immigrants from Czechoslovakia (2.0%, a difference of 0.21%), and Armenian (2.0%, a difference of 0.26%).
| Demographics | Rating | Rank | Vision Disability |
| Argentineans | 99.1 /100 | #59 | Exceptional 2.0% |
| Immigrants | Romania | 99.1 /100 | #60 | Exceptional 2.0% |
| Immigrants | Belgium | 99.1 /100 | #61 | Exceptional 2.0% |
| Immigrants | Russia | 99.1 /100 | #62 | Exceptional 2.0% |
| Armenians | 99.0 /100 | #63 | Exceptional 2.0% |
| Immigrants | Greece | 99.0 /100 | #64 | Exceptional 2.0% |
| Maltese | 98.9 /100 | #65 | Exceptional 2.0% |
| Immigrants | Argentina | 98.9 /100 | #66 | Exceptional 2.0% |
| Immigrants | Northern Africa | 98.8 /100 | #67 | Exceptional 2.0% |
| Immigrants | Czechoslovakia | 98.7 /100 | #68 | Exceptional 2.0% |
| Russians | 98.6 /100 | #69 | Exceptional 2.0% |
| Immigrants | Kazakhstan | 98.6 /100 | #70 | Exceptional 2.0% |
| Immigrants | Northern Europe | 98.6 /100 | #71 | Exceptional 2.0% |
| Immigrants | France | 98.5 /100 | #72 | Exceptional 2.0% |
| Immigrants | Eritrea | 98.4 /100 | #73 | Exceptional 2.0% |