Immigrants from Thailand vs American Householder Income Ages 45 - 64 years
COMPARE
Immigrants from Thailand
American
Householder Income Ages 45 - 64 years
Householder Income Ages 45 - 64 years Comparison
Immigrants from Thailand
Americans
$97,400
HOUSEHOLDER INCOME AGES 45 - 64 YEARS
18.8/ 100
METRIC RATING
203rd/ 347
METRIC RANK
$90,536
HOUSEHOLDER INCOME AGES 45 - 64 YEARS
0.7/ 100
METRIC RATING
251st/ 347
METRIC RANK
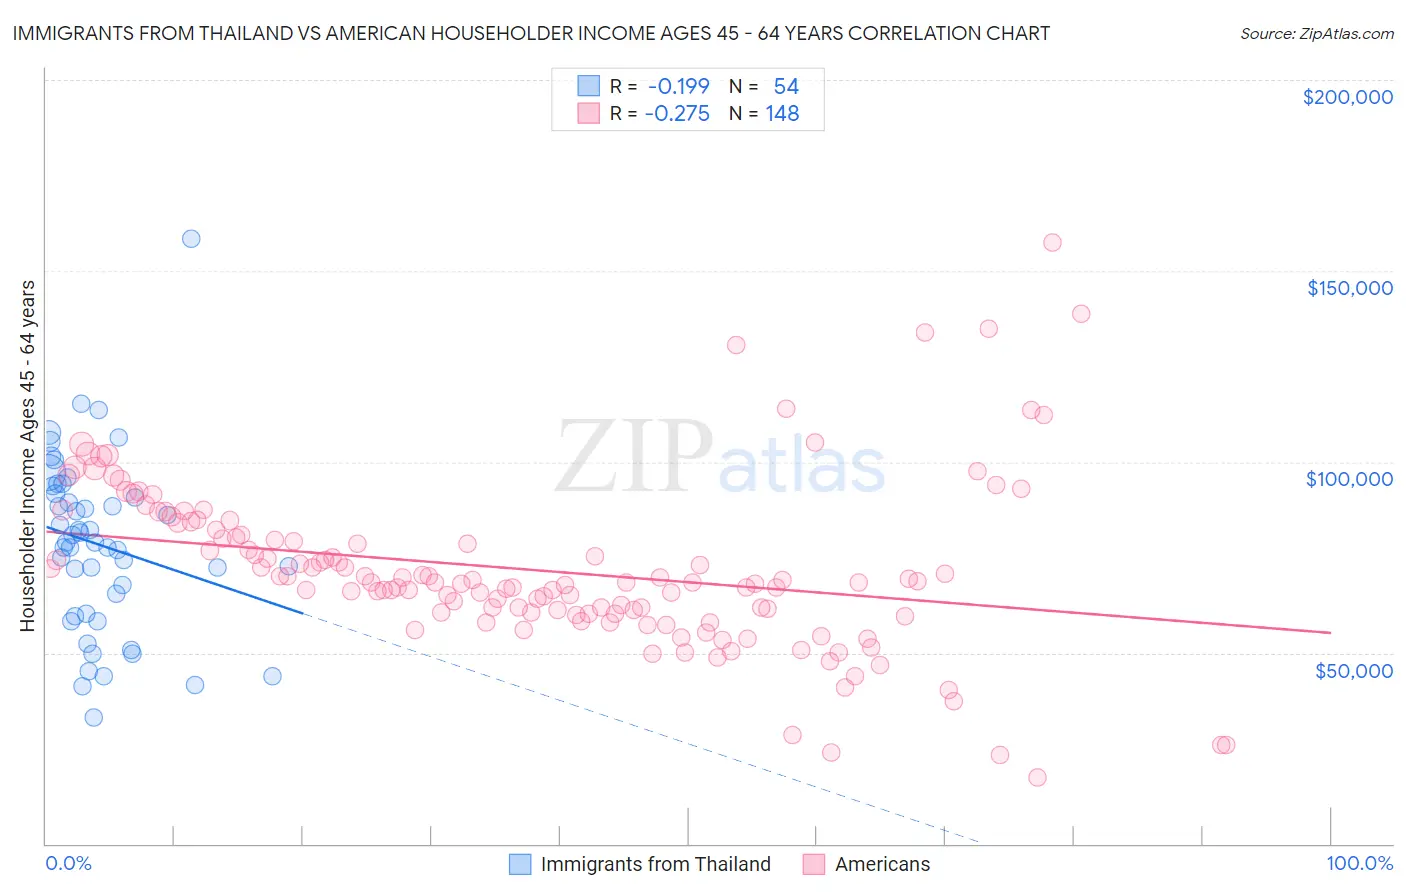
Immigrants from Thailand vs American Householder Income Ages 45 - 64 years Correlation Chart
The statistical analysis conducted on geographies consisting of 316,747,183 people shows a poor negative correlation between the proportion of Immigrants from Thailand and household income with householder between the ages 45 and 64 in the United States with a correlation coefficient (R) of -0.199 and weighted average of $97,400. Similarly, the statistical analysis conducted on geographies consisting of 577,131,423 people shows a weak negative correlation between the proportion of Americans and household income with householder between the ages 45 and 64 in the United States with a correlation coefficient (R) of -0.275 and weighted average of $90,536, a difference of 7.6%.
Householder Income Ages 45 - 64 years Correlation Summary
| Measurement | Immigrants from Thailand | American |
| Minimum | $32,910 | $17,292 |
| Maximum | $158,417 | $157,566 |
| Range | $125,507 | $140,274 |
| Mean | $78,332 | $71,716 |
| Median | $78,883 | $68,424 |
| Interquartile 25% (IQ1) | $60,388 | $60,397 |
| Interquartile 75% (IQ3) | $91,575 | $81,558 |
| Interquartile Range (IQR) | $31,186 | $21,160 |
| Standard Deviation (Sample) | $23,014 | $21,955 |
| Standard Deviation (Population) | $22,800 | $21,881 |
Similar Demographics by Householder Income Ages 45 - 64 years
Demographics Similar to Immigrants from Thailand by Householder Income Ages 45 - 64 years
In terms of householder income ages 45 - 64 years, the demographic groups most similar to Immigrants from Thailand are Tlingit-Haida ($97,417, a difference of 0.020%), Immigrants from Eritrea ($97,373, a difference of 0.030%), Immigrants from Colombia ($97,290, a difference of 0.11%), Immigrants from Africa ($97,284, a difference of 0.12%), and Ghanaian ($97,277, a difference of 0.13%).
| Demographics | Rating | Rank | Householder Income Ages 45 - 64 years |
| Immigrants | Eastern Africa | 28.3 /100 | #196 | Fair $98,467 |
| Puget Sound Salish | 27.0 /100 | #197 | Fair $98,340 |
| Immigrants | Iraq | 25.7 /100 | #198 | Fair $98,201 |
| Whites/Caucasians | 24.6 /100 | #199 | Fair $98,091 |
| Immigrants | Kenya | 23.5 /100 | #200 | Fair $97,964 |
| Yugoslavians | 20.0 /100 | #201 | Fair $97,558 |
| Tlingit-Haida | 18.9 /100 | #202 | Poor $97,417 |
| Immigrants | Thailand | 18.8 /100 | #203 | Poor $97,400 |
| Immigrants | Eritrea | 18.6 /100 | #204 | Poor $97,373 |
| Immigrants | Colombia | 18.0 /100 | #205 | Poor $97,290 |
| Immigrants | Africa | 17.9 /100 | #206 | Poor $97,284 |
| Ghanaians | 17.9 /100 | #207 | Poor $97,277 |
| Scotch-Irish | 16.4 /100 | #208 | Poor $97,073 |
| Japanese | 14.8 /100 | #209 | Poor $96,834 |
| Tsimshian | 14.5 /100 | #210 | Poor $96,783 |
Demographics Similar to Americans by Householder Income Ages 45 - 64 years
In terms of householder income ages 45 - 64 years, the demographic groups most similar to Americans are Marshallese ($90,455, a difference of 0.090%), Subsaharan African ($90,691, a difference of 0.17%), Mexican American Indian ($90,811, a difference of 0.30%), Barbadian ($90,266, a difference of 0.30%), and Immigrants from Guyana ($90,186, a difference of 0.39%).
| Demographics | Rating | Rank | Householder Income Ages 45 - 64 years |
| Immigrants | Middle Africa | 1.1 /100 | #244 | Tragic $91,293 |
| Guyanese | 0.9 /100 | #245 | Tragic $90,966 |
| Central Americans | 0.9 /100 | #246 | Tragic $90,951 |
| Alaskan Athabascans | 0.9 /100 | #247 | Tragic $90,951 |
| Immigrants | Laos | 0.9 /100 | #248 | Tragic $90,909 |
| Mexican American Indians | 0.8 /100 | #249 | Tragic $90,811 |
| Sub-Saharan Africans | 0.8 /100 | #250 | Tragic $90,691 |
| Americans | 0.7 /100 | #251 | Tragic $90,536 |
| Marshallese | 0.7 /100 | #252 | Tragic $90,455 |
| Barbadians | 0.6 /100 | #253 | Tragic $90,266 |
| Immigrants | Guyana | 0.6 /100 | #254 | Tragic $90,186 |
| West Indians | 0.5 /100 | #255 | Tragic $89,906 |
| French American Indians | 0.5 /100 | #256 | Tragic $89,811 |
| German Russians | 0.4 /100 | #257 | Tragic $89,398 |
| Immigrants | Barbados | 0.4 /100 | #258 | Tragic $89,394 |