Immigrants from Taiwan vs Ute No Vehicles in Household
COMPARE
Immigrants from Taiwan
Ute
No Vehicles in Household
No Vehicles in Household Comparison
Immigrants from Taiwan
Ute
7.7%
NO VEHICLES IN HOUSEHOLD
100.0/ 100
METRIC RATING
33rd/ 347
METRIC RANK
11.6%
NO VEHICLES IN HOUSEHOLD
3.3/ 100
METRIC RATING
237th/ 347
METRIC RANK
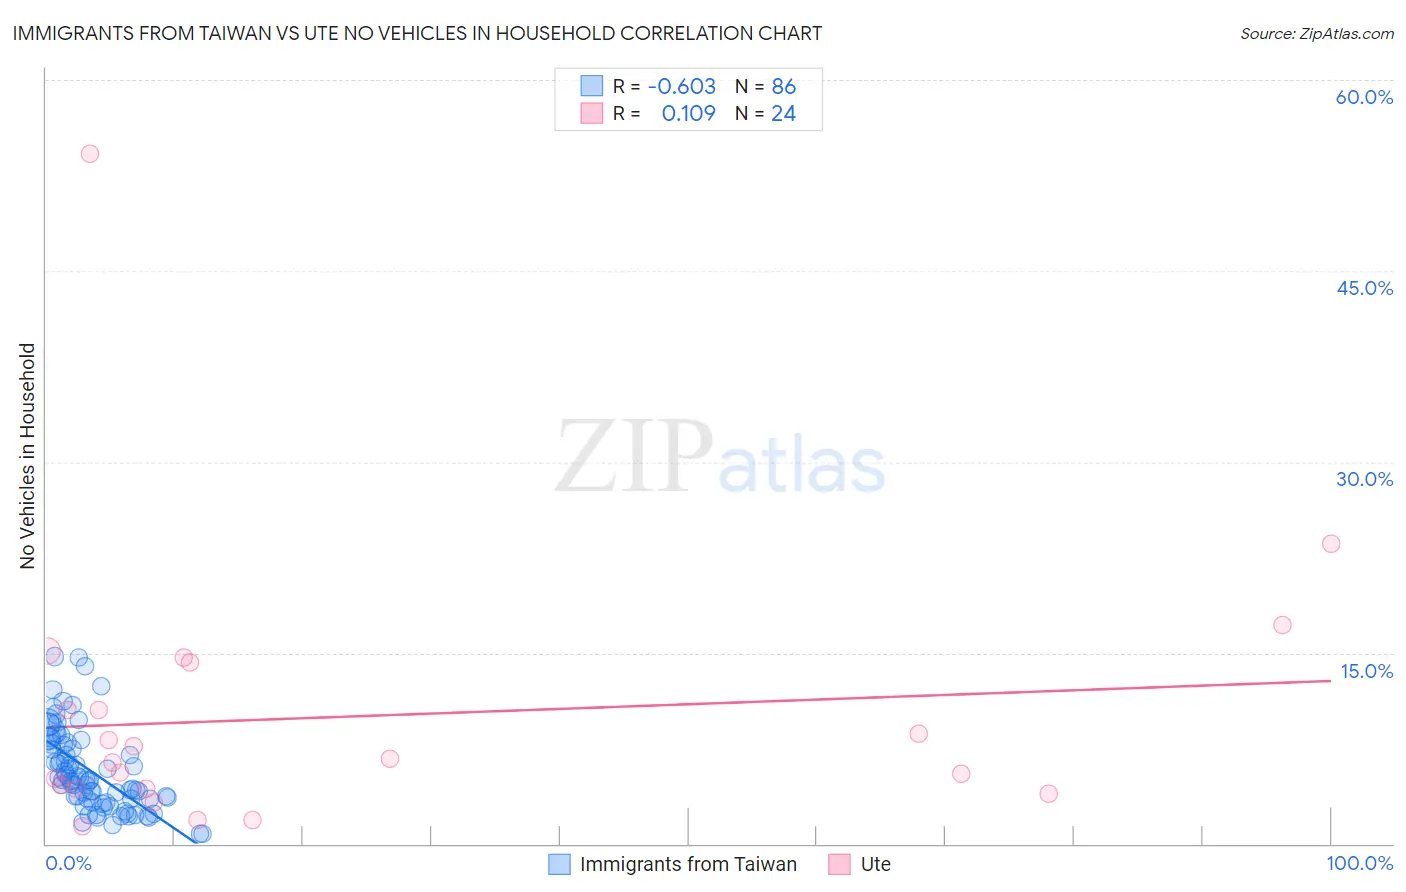
Immigrants from Taiwan vs Ute No Vehicles in Household Correlation Chart
The statistical analysis conducted on geographies consisting of 276,659,382 people shows a significant negative correlation between the proportion of Immigrants from Taiwan and percentage of households with no vehicle available in the United States with a correlation coefficient (R) of -0.603 and weighted average of 7.7%. Similarly, the statistical analysis conducted on geographies consisting of 55,604,944 people shows a poor positive correlation between the proportion of Ute and percentage of households with no vehicle available in the United States with a correlation coefficient (R) of 0.109 and weighted average of 11.6%, a difference of 50.3%.
No Vehicles in Household Correlation Summary
| Measurement | Immigrants from Taiwan | Ute |
| Minimum | 0.80% | 1.3% |
| Maximum | 14.7% | 54.2% |
| Range | 13.9% | 52.9% |
| Mean | 5.7% | 10.0% |
| Median | 5.0% | 6.5% |
| Interquartile 25% (IQ1) | 3.5% | 4.3% |
| Interquartile 75% (IQ3) | 7.8% | 12.4% |
| Interquartile Range (IQR) | 4.2% | 8.1% |
| Standard Deviation (Sample) | 3.2% | 10.9% |
| Standard Deviation (Population) | 3.2% | 10.7% |
Similar Demographics by No Vehicles in Household
Demographics Similar to Immigrants from Taiwan by No Vehicles in Household
In terms of no vehicles in household, the demographic groups most similar to Immigrants from Taiwan are Malaysian (7.7%, a difference of 0.11%), Immigrants from Vietnam (7.7%, a difference of 0.13%), Cherokee (7.7%, a difference of 0.27%), Native Hawaiian (7.7%, a difference of 0.36%), and Iraqi (7.7%, a difference of 0.41%).
| Demographics | Rating | Rank | No Vehicles in Household |
| Sri Lankans | 100.0 /100 | #26 | Exceptional 7.6% |
| British | 100.0 /100 | #27 | Exceptional 7.6% |
| Samoans | 100.0 /100 | #28 | Exceptional 7.6% |
| Americans | 100.0 /100 | #29 | Exceptional 7.7% |
| Finns | 100.0 /100 | #30 | Exceptional 7.7% |
| Native Hawaiians | 100.0 /100 | #31 | Exceptional 7.7% |
| Malaysians | 100.0 /100 | #32 | Exceptional 7.7% |
| Immigrants | Taiwan | 100.0 /100 | #33 | Exceptional 7.7% |
| Immigrants | Vietnam | 100.0 /100 | #34 | Exceptional 7.7% |
| Cherokee | 99.9 /100 | #35 | Exceptional 7.7% |
| Iraqis | 99.9 /100 | #36 | Exceptional 7.7% |
| Basques | 99.9 /100 | #37 | Exceptional 7.8% |
| Creek | 99.9 /100 | #38 | Exceptional 7.8% |
| Immigrants | Fiji | 99.9 /100 | #39 | Exceptional 7.8% |
| Czechoslovakians | 99.9 /100 | #40 | Exceptional 7.8% |
Demographics Similar to Ute by No Vehicles in Household
In terms of no vehicles in household, the demographic groups most similar to Ute are Russian (11.6%, a difference of 0.050%), Cree (11.6%, a difference of 0.24%), Taiwanese (11.7%, a difference of 0.51%), Immigrants (11.7%, a difference of 0.57%), and Eastern European (11.7%, a difference of 0.58%).
| Demographics | Rating | Rank | No Vehicles in Household |
| Immigrants | Norway | 5.1 /100 | #230 | Tragic 11.4% |
| Immigrants | Japan | 5.1 /100 | #231 | Tragic 11.4% |
| Immigrants | Turkey | 4.8 /100 | #232 | Tragic 11.5% |
| Houma | 4.7 /100 | #233 | Tragic 11.5% |
| Immigrants | Peru | 4.5 /100 | #234 | Tragic 11.5% |
| Kiowa | 4.0 /100 | #235 | Tragic 11.5% |
| Cree | 3.5 /100 | #236 | Tragic 11.6% |
| Ute | 3.3 /100 | #237 | Tragic 11.6% |
| Russians | 3.2 /100 | #238 | Tragic 11.6% |
| Taiwanese | 2.8 /100 | #239 | Tragic 11.7% |
| Immigrants | Immigrants | 2.7 /100 | #240 | Tragic 11.7% |
| Eastern Europeans | 2.7 /100 | #241 | Tragic 11.7% |
| Turks | 2.6 /100 | #242 | Tragic 11.7% |
| Cheyenne | 2.4 /100 | #243 | Tragic 11.7% |
| Immigrants | Portugal | 2.2 /100 | #244 | Tragic 11.7% |