Immigrants from Taiwan vs Polish Self-Care Disability
COMPARE
Immigrants from Taiwan
Polish
Self-Care Disability
Self-Care Disability Comparison
Immigrants from Taiwan
Poles
2.2%
SELF-CARE DISABILITY
100.0/ 100
METRIC RATING
18th/ 347
METRIC RANK
2.4%
SELF-CARE DISABILITY
88.9/ 100
METRIC RATING
131st/ 347
METRIC RANK
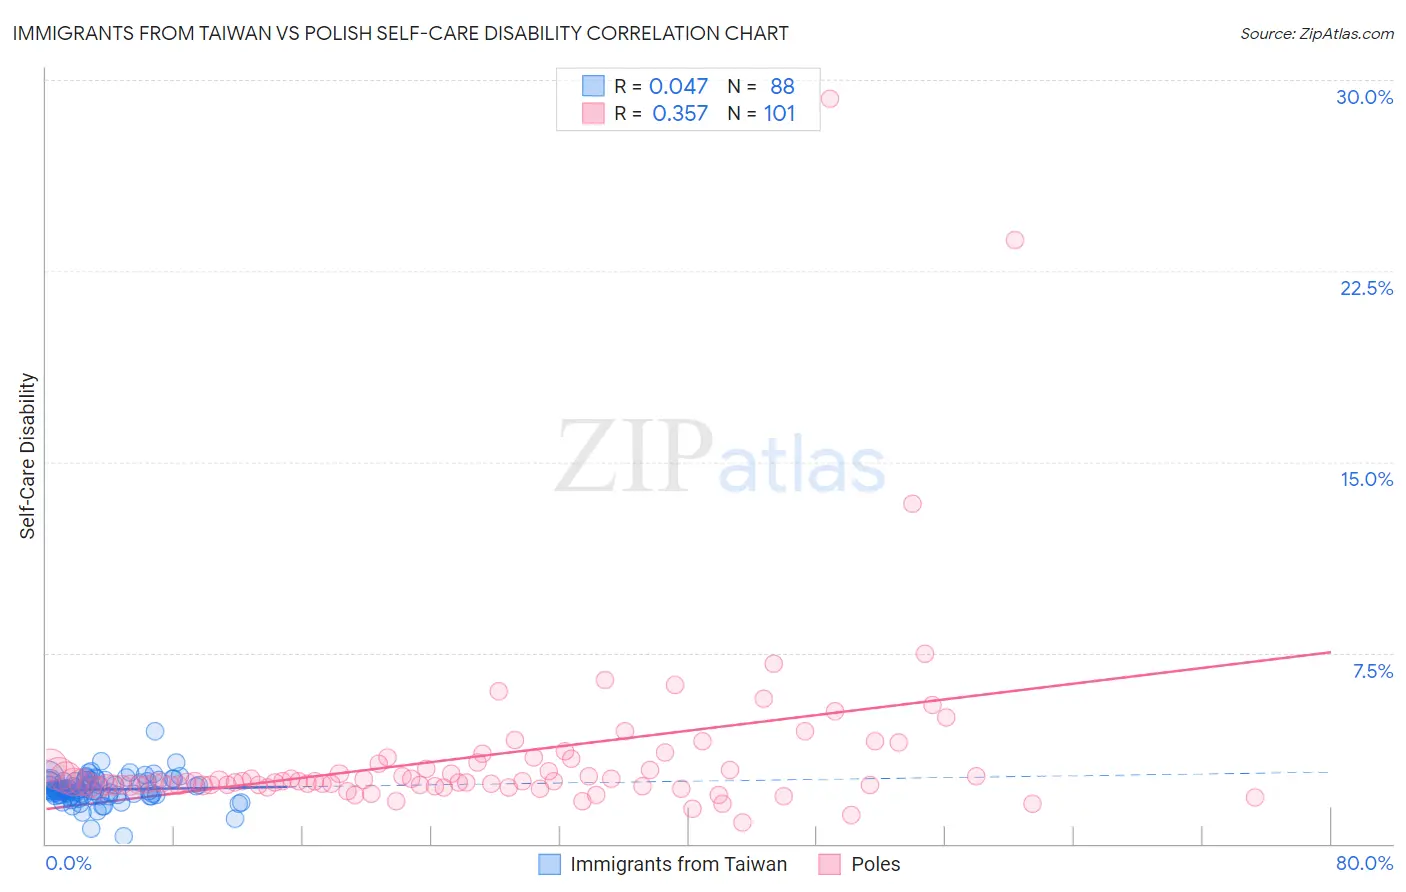
Immigrants from Taiwan vs Polish Self-Care Disability Correlation Chart
The statistical analysis conducted on geographies consisting of 297,966,372 people shows no correlation between the proportion of Immigrants from Taiwan and percentage of population with self-care disability in the United States with a correlation coefficient (R) of 0.047 and weighted average of 2.2%. Similarly, the statistical analysis conducted on geographies consisting of 558,400,698 people shows a mild positive correlation between the proportion of Poles and percentage of population with self-care disability in the United States with a correlation coefficient (R) of 0.357 and weighted average of 2.4%, a difference of 8.7%.
Self-Care Disability Correlation Summary
| Measurement | Immigrants from Taiwan | Polish |
| Minimum | 0.31% | 0.81% |
| Maximum | 4.4% | 29.3% |
| Range | 4.1% | 28.5% |
| Mean | 2.1% | 3.4% |
| Median | 2.1% | 2.4% |
| Interquartile 25% (IQ1) | 1.9% | 2.3% |
| Interquartile 75% (IQ3) | 2.5% | 3.2% |
| Interquartile Range (IQR) | 0.58% | 0.88% |
| Standard Deviation (Sample) | 0.54% | 3.7% |
| Standard Deviation (Population) | 0.54% | 3.7% |
Similar Demographics by Self-Care Disability
Demographics Similar to Immigrants from Taiwan by Self-Care Disability
In terms of self-care disability, the demographic groups most similar to Immigrants from Taiwan are Immigrants from Saudi Arabia (2.2%, a difference of 0.25%), Immigrants from Eritrea (2.2%, a difference of 0.33%), Tongan (2.2%, a difference of 0.41%), Immigrants from Kuwait (2.2%, a difference of 0.42%), and Bulgarian (2.2%, a difference of 0.66%).
| Demographics | Rating | Rank | Self-Care Disability |
| Immigrants | South Central Asia | 100.0 /100 | #11 | Exceptional 2.2% |
| Immigrants | Ethiopia | 100.0 /100 | #12 | Exceptional 2.2% |
| Ethiopians | 100.0 /100 | #13 | Exceptional 2.2% |
| Luxembourgers | 100.0 /100 | #14 | Exceptional 2.2% |
| Okinawans | 100.0 /100 | #15 | Exceptional 2.2% |
| Immigrants | Kuwait | 100.0 /100 | #16 | Exceptional 2.2% |
| Immigrants | Saudi Arabia | 100.0 /100 | #17 | Exceptional 2.2% |
| Immigrants | Taiwan | 100.0 /100 | #18 | Exceptional 2.2% |
| Immigrants | Eritrea | 100.0 /100 | #19 | Exceptional 2.2% |
| Tongans | 100.0 /100 | #20 | Exceptional 2.2% |
| Bulgarians | 100.0 /100 | #21 | Exceptional 2.2% |
| Immigrants | Venezuela | 100.0 /100 | #22 | Exceptional 2.2% |
| Cambodians | 100.0 /100 | #23 | Exceptional 2.2% |
| Cypriots | 100.0 /100 | #24 | Exceptional 2.2% |
| Turks | 100.0 /100 | #25 | Exceptional 2.2% |
Demographics Similar to Poles by Self-Care Disability
In terms of self-care disability, the demographic groups most similar to Poles are Immigrants from South America (2.4%, a difference of 0.010%), Immigrants from Austria (2.4%, a difference of 0.020%), Immigrants from Colombia (2.4%, a difference of 0.040%), Immigrants from Romania (2.4%, a difference of 0.050%), and Russian (2.4%, a difference of 0.080%).
| Demographics | Rating | Rank | Self-Care Disability |
| Immigrants | North America | 90.2 /100 | #124 | Exceptional 2.4% |
| Immigrants | Morocco | 90.2 /100 | #124 | Exceptional 2.4% |
| Hmong | 89.9 /100 | #126 | Excellent 2.4% |
| Colombians | 89.7 /100 | #127 | Excellent 2.4% |
| Immigrants | Hungary | 89.6 /100 | #128 | Excellent 2.4% |
| Immigrants | Romania | 89.3 /100 | #129 | Excellent 2.4% |
| Immigrants | Austria | 89.0 /100 | #130 | Excellent 2.4% |
| Poles | 88.9 /100 | #131 | Excellent 2.4% |
| Immigrants | South America | 88.8 /100 | #132 | Excellent 2.4% |
| Immigrants | Colombia | 88.5 /100 | #133 | Excellent 2.4% |
| Russians | 88.2 /100 | #134 | Excellent 2.4% |
| Laotians | 87.8 /100 | #135 | Excellent 2.4% |
| South American Indians | 87.2 /100 | #136 | Excellent 2.4% |
| Austrians | 87.0 /100 | #137 | Excellent 2.4% |
| Immigrants | Croatia | 86.6 /100 | #138 | Excellent 2.4% |