Immigrants from Taiwan vs European Ambulatory Disability
COMPARE
Immigrants from Taiwan
European
Ambulatory Disability
Ambulatory Disability Comparison
Immigrants from Taiwan
Europeans
4.9%
AMBULATORY DISABILITY
100.0/ 100
METRIC RATING
4th/ 347
METRIC RANK
6.2%
AMBULATORY DISABILITY
36.2/ 100
METRIC RATING
186th/ 347
METRIC RANK
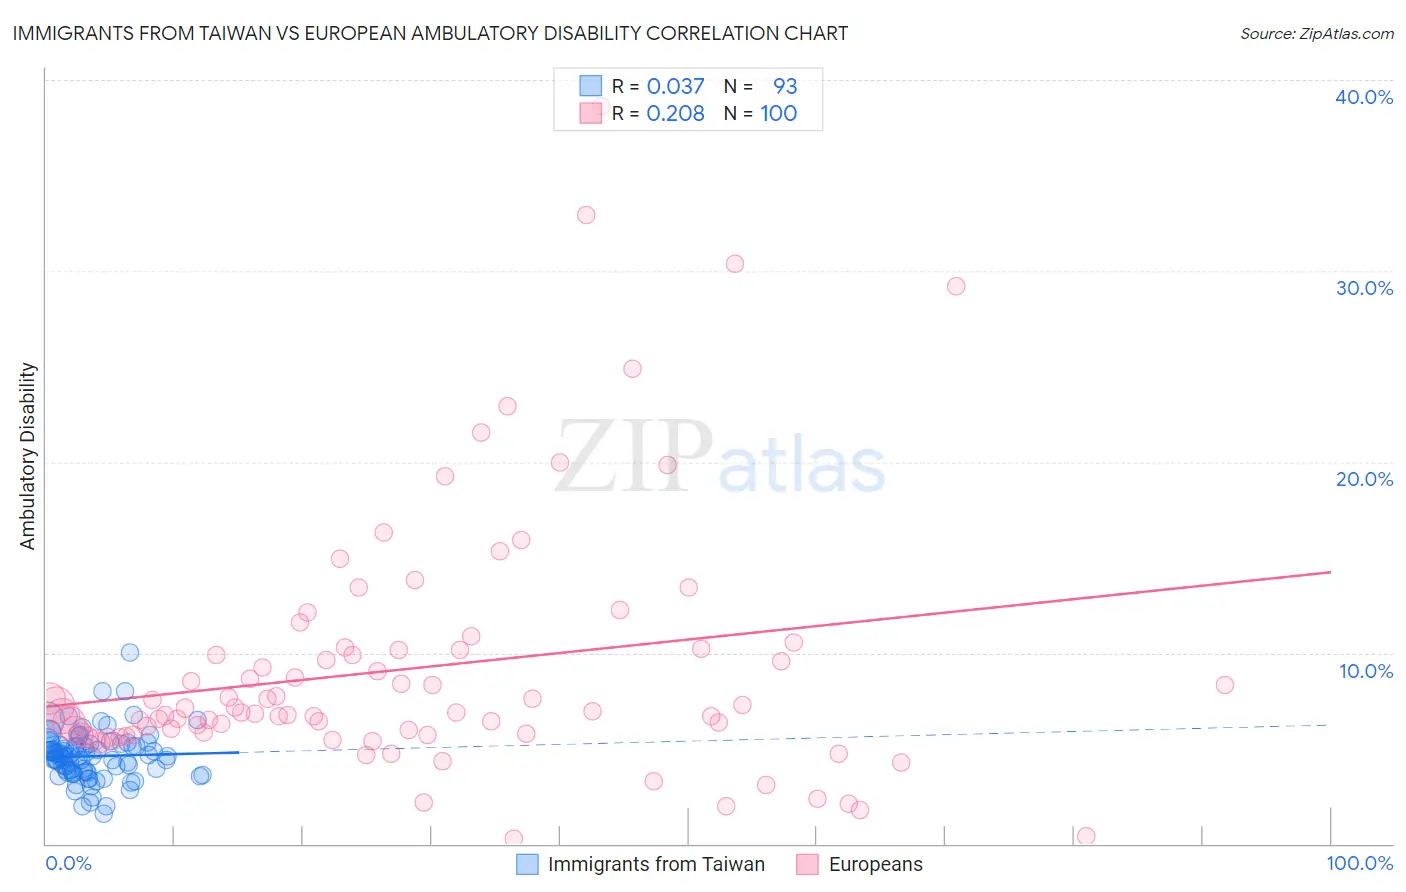
Immigrants from Taiwan vs European Ambulatory Disability Correlation Chart
The statistical analysis conducted on geographies consisting of 298,204,789 people shows no correlation between the proportion of Immigrants from Taiwan and percentage of population with ambulatory disability in the United States with a correlation coefficient (R) of 0.037 and weighted average of 4.9%. Similarly, the statistical analysis conducted on geographies consisting of 561,341,631 people shows a weak positive correlation between the proportion of Europeans and percentage of population with ambulatory disability in the United States with a correlation coefficient (R) of 0.208 and weighted average of 6.2%, a difference of 24.9%.
Ambulatory Disability Correlation Summary
| Measurement | Immigrants from Taiwan | European |
| Minimum | 1.6% | 0.26% |
| Maximum | 10.0% | 38.6% |
| Range | 8.4% | 38.4% |
| Mean | 4.6% | 9.2% |
| Median | 4.6% | 6.9% |
| Interquartile 25% (IQ1) | 3.7% | 5.7% |
| Interquartile 75% (IQ3) | 5.2% | 10.2% |
| Interquartile Range (IQR) | 1.4% | 4.5% |
| Standard Deviation (Sample) | 1.3% | 6.7% |
| Standard Deviation (Population) | 1.3% | 6.7% |
Similar Demographics by Ambulatory Disability
Demographics Similar to Immigrants from Taiwan by Ambulatory Disability
In terms of ambulatory disability, the demographic groups most similar to Immigrants from Taiwan are Thai (4.9%, a difference of 0.24%), Immigrants from Singapore (5.0%, a difference of 1.4%), Filipino (4.9%, a difference of 1.4%), Immigrants from Bolivia (5.0%, a difference of 2.1%), and Bolivian (5.1%, a difference of 2.5%).
| Demographics | Rating | Rank | Ambulatory Disability |
| Immigrants | India | 100.0 /100 | #1 | Exceptional 4.8% |
| Filipinos | 100.0 /100 | #2 | Exceptional 4.9% |
| Thais | 100.0 /100 | #3 | Exceptional 4.9% |
| Immigrants | Taiwan | 100.0 /100 | #4 | Exceptional 4.9% |
| Immigrants | Singapore | 100.0 /100 | #5 | Exceptional 5.0% |
| Immigrants | Bolivia | 100.0 /100 | #6 | Exceptional 5.0% |
| Bolivians | 100.0 /100 | #7 | Exceptional 5.1% |
| Immigrants | South Central Asia | 100.0 /100 | #8 | Exceptional 5.1% |
| Iranians | 100.0 /100 | #9 | Exceptional 5.1% |
| Yup'ik | 100.0 /100 | #10 | Exceptional 5.2% |
| Immigrants | Korea | 100.0 /100 | #11 | Exceptional 5.2% |
| Okinawans | 100.0 /100 | #12 | Exceptional 5.3% |
| Burmese | 100.0 /100 | #13 | Exceptional 5.3% |
| Immigrants | Eastern Asia | 100.0 /100 | #14 | Exceptional 5.3% |
| Immigrants | China | 100.0 /100 | #15 | Exceptional 5.3% |
Demographics Similar to Europeans by Ambulatory Disability
In terms of ambulatory disability, the demographic groups most similar to Europeans are Carpatho Rusyn (6.2%, a difference of 0.050%), Immigrants from Bosnia and Herzegovina (6.2%, a difference of 0.060%), British (6.2%, a difference of 0.11%), Ukrainian (6.2%, a difference of 0.13%), and Immigrants from Western Africa (6.2%, a difference of 0.17%).
| Demographics | Rating | Rank | Ambulatory Disability |
| Austrians | 44.1 /100 | #179 | Average 6.1% |
| Immigrants | Nicaragua | 43.9 /100 | #180 | Average 6.1% |
| Swiss | 43.1 /100 | #181 | Average 6.1% |
| Serbians | 42.8 /100 | #182 | Average 6.1% |
| Immigrants | Thailand | 42.2 /100 | #183 | Average 6.1% |
| Immigrants | Ghana | 41.2 /100 | #184 | Average 6.1% |
| Immigrants | Bosnia and Herzegovina | 37.2 /100 | #185 | Fair 6.2% |
| Europeans | 36.2 /100 | #186 | Fair 6.2% |
| Carpatho Rusyns | 35.3 /100 | #187 | Fair 6.2% |
| British | 34.3 /100 | #188 | Fair 6.2% |
| Ukrainians | 34.0 /100 | #189 | Fair 6.2% |
| Immigrants | Western Africa | 33.4 /100 | #190 | Fair 6.2% |
| Immigrants | Guatemala | 31.9 /100 | #191 | Fair 6.2% |
| Immigrants | Western Europe | 31.6 /100 | #192 | Fair 6.2% |
| Guatemalans | 30.0 /100 | #193 | Fair 6.2% |