Immigrants from Sweden vs Immigrants from Cambodia Median Male Earnings
COMPARE
Immigrants from Sweden
Immigrants from Cambodia
Median Male Earnings
Median Male Earnings Comparison
Immigrants from Sweden
Immigrants from Cambodia
$65,406
MEDIAN MALE EARNINGS
100.0/ 100
METRIC RATING
21st/ 347
METRIC RANK
$51,594
MEDIAN MALE EARNINGS
5.5/ 100
METRIC RATING
224th/ 347
METRIC RANK
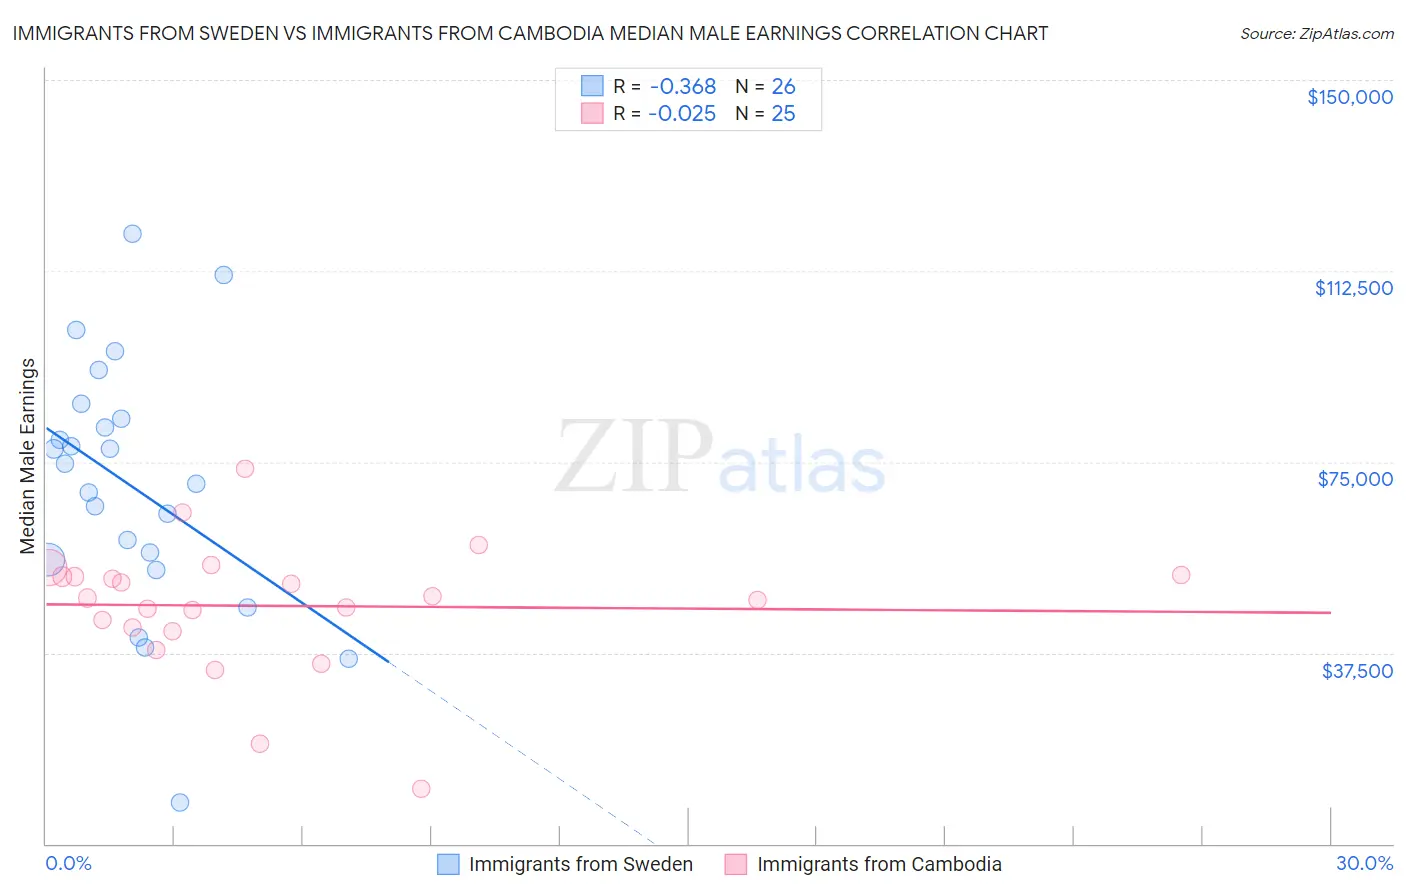
Immigrants from Sweden vs Immigrants from Cambodia Median Male Earnings Correlation Chart
The statistical analysis conducted on geographies consisting of 164,719,286 people shows a mild negative correlation between the proportion of Immigrants from Sweden and median male earnings in the United States with a correlation coefficient (R) of -0.368 and weighted average of $65,406. Similarly, the statistical analysis conducted on geographies consisting of 205,144,142 people shows no correlation between the proportion of Immigrants from Cambodia and median male earnings in the United States with a correlation coefficient (R) of -0.025 and weighted average of $51,594, a difference of 26.8%.
Median Male Earnings Correlation Summary
| Measurement | Immigrants from Sweden | Immigrants from Cambodia |
| Minimum | $8,107 | $10,761 |
| Maximum | $119,732 | $73,759 |
| Range | $111,625 | $62,998 |
| Mean | $70,306 | $46,720 |
| Median | $72,770 | $48,267 |
| Interquartile 25% (IQ1) | $55,777 | $42,101 |
| Interquartile 75% (IQ3) | $83,429 | $52,654 |
| Interquartile Range (IQR) | $27,652 | $10,554 |
| Standard Deviation (Sample) | $24,867 | $12,824 |
| Standard Deviation (Population) | $24,384 | $12,565 |
Similar Demographics by Median Male Earnings
Demographics Similar to Immigrants from Sweden by Median Male Earnings
In terms of median male earnings, the demographic groups most similar to Immigrants from Sweden are Immigrants from Japan ($65,518, a difference of 0.17%), Cypriot ($65,549, a difference of 0.22%), Burmese ($65,236, a difference of 0.26%), Immigrants from Korea ($65,079, a difference of 0.50%), and Immigrants from Northern Europe ($64,987, a difference of 0.65%).
| Demographics | Rating | Rank | Median Male Earnings |
| Okinawans | 100.0 /100 | #14 | Exceptional $67,232 |
| Immigrants | Eastern Asia | 100.0 /100 | #15 | Exceptional $66,903 |
| Eastern Europeans | 100.0 /100 | #16 | Exceptional $66,472 |
| Immigrants | Belgium | 100.0 /100 | #17 | Exceptional $66,125 |
| Indians (Asian) | 100.0 /100 | #18 | Exceptional $66,078 |
| Cypriots | 100.0 /100 | #19 | Exceptional $65,549 |
| Immigrants | Japan | 100.0 /100 | #20 | Exceptional $65,518 |
| Immigrants | Sweden | 100.0 /100 | #21 | Exceptional $65,406 |
| Burmese | 100.0 /100 | #22 | Exceptional $65,236 |
| Immigrants | Korea | 100.0 /100 | #23 | Exceptional $65,079 |
| Immigrants | Northern Europe | 100.0 /100 | #24 | Exceptional $64,987 |
| Immigrants | Denmark | 100.0 /100 | #25 | Exceptional $64,625 |
| Turks | 100.0 /100 | #26 | Exceptional $64,253 |
| Immigrants | Switzerland | 100.0 /100 | #27 | Exceptional $63,944 |
| Russians | 100.0 /100 | #28 | Exceptional $63,939 |
Demographics Similar to Immigrants from Cambodia by Median Male Earnings
In terms of median male earnings, the demographic groups most similar to Immigrants from Cambodia are Ecuadorian ($51,596, a difference of 0.0%), Immigrants from Bangladesh ($51,642, a difference of 0.090%), Immigrants from Senegal ($51,647, a difference of 0.10%), Immigrants from Sudan ($51,489, a difference of 0.20%), and Japanese ($51,473, a difference of 0.23%).
| Demographics | Rating | Rank | Median Male Earnings |
| Nigerians | 8.3 /100 | #217 | Tragic $52,039 |
| Immigrants | Panama | 7.7 /100 | #218 | Tragic $51,962 |
| Immigrants | Ghana | 6.9 /100 | #219 | Tragic $51,836 |
| Immigrants | Armenia | 6.6 /100 | #220 | Tragic $51,793 |
| Immigrants | Senegal | 5.8 /100 | #221 | Tragic $51,647 |
| Immigrants | Bangladesh | 5.8 /100 | #222 | Tragic $51,642 |
| Ecuadorians | 5.5 /100 | #223 | Tragic $51,596 |
| Immigrants | Cambodia | 5.5 /100 | #224 | Tragic $51,594 |
| Immigrants | Sudan | 5.0 /100 | #225 | Tragic $51,489 |
| Japanese | 4.9 /100 | #226 | Tragic $51,473 |
| Trinidadians and Tobagonians | 4.8 /100 | #227 | Tragic $51,446 |
| Samoans | 4.6 /100 | #228 | Tragic $51,389 |
| Immigrants | Trinidad and Tobago | 4.5 /100 | #229 | Tragic $51,376 |
| Immigrants | Nigeria | 4.2 /100 | #230 | Tragic $51,310 |
| Barbadians | 3.9 /100 | #231 | Tragic $51,236 |