Immigrants from Sweden vs Greek 3rd Grade
COMPARE
Immigrants from Sweden
Greek
3rd Grade
3rd Grade Comparison
Immigrants from Sweden
Greeks
98.1%
3RD GRADE
98.9/ 100
METRIC RATING
84th/ 347
METRIC RANK
98.3%
3RD GRADE
99.7/ 100
METRIC RATING
58th/ 347
METRIC RANK
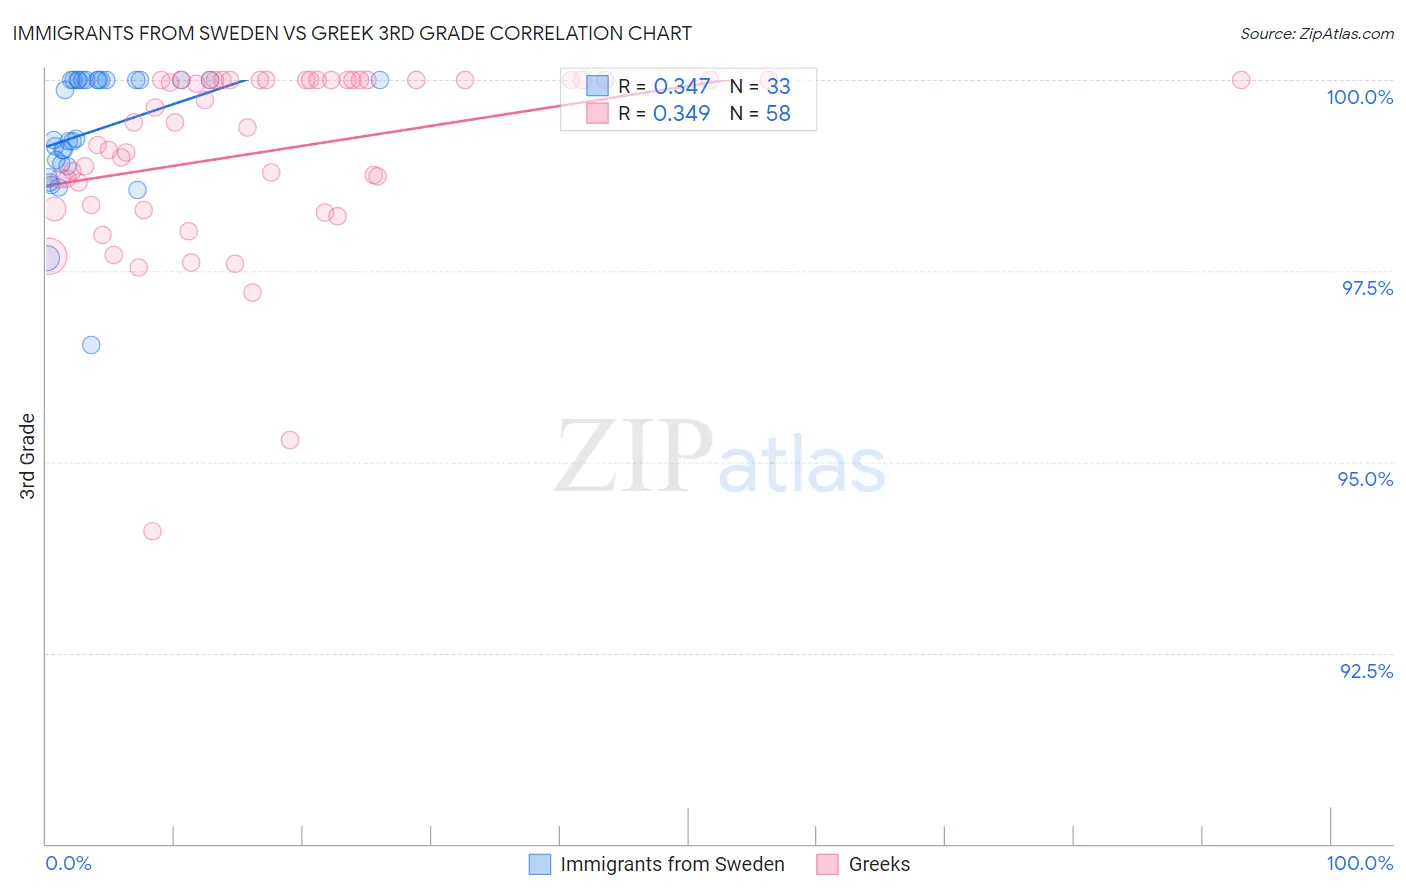
Immigrants from Sweden vs Greek 3rd Grade Correlation Chart
The statistical analysis conducted on geographies consisting of 164,737,092 people shows a mild positive correlation between the proportion of Immigrants from Sweden and percentage of population with at least 3rd grade education in the United States with a correlation coefficient (R) of 0.347 and weighted average of 98.1%. Similarly, the statistical analysis conducted on geographies consisting of 482,775,358 people shows a mild positive correlation between the proportion of Greeks and percentage of population with at least 3rd grade education in the United States with a correlation coefficient (R) of 0.349 and weighted average of 98.3%, a difference of 0.12%.
3rd Grade Correlation Summary
| Measurement | Immigrants from Sweden | Greek |
| Minimum | 96.5% | 94.1% |
| Maximum | 100.0% | 100.0% |
| Range | 3.5% | 5.9% |
| Mean | 99.3% | 99.1% |
| Median | 99.2% | 99.4% |
| Interquartile 25% (IQ1) | 98.9% | 98.4% |
| Interquartile 75% (IQ3) | 100.0% | 100.0% |
| Interquartile Range (IQR) | 1.1% | 1.6% |
| Standard Deviation (Sample) | 0.81% | 1.2% |
| Standard Deviation (Population) | 0.79% | 1.2% |
Similar Demographics by 3rd Grade
Demographics Similar to Immigrants from Sweden by 3rd Grade
In terms of 3rd grade, the demographic groups most similar to Immigrants from Sweden are Ukrainian (98.1%, a difference of 0.0%), Immigrants from Australia (98.1%, a difference of 0.0%), Potawatomi (98.1%, a difference of 0.0%), Immigrants from Denmark (98.1%, a difference of 0.0%), and Immigrants from India (98.1%, a difference of 0.0%).
| Demographics | Rating | Rank | 3rd Grade |
| Immigrants | Lithuania | 99.2 /100 | #77 | Exceptional 98.2% |
| Osage | 99.2 /100 | #78 | Exceptional 98.2% |
| Immigrants | Belgium | 99.1 /100 | #79 | Exceptional 98.1% |
| Macedonians | 99.1 /100 | #80 | Exceptional 98.1% |
| Icelanders | 99.1 /100 | #81 | Exceptional 98.1% |
| Shoshone | 99.0 /100 | #82 | Exceptional 98.1% |
| Ukrainians | 98.9 /100 | #83 | Exceptional 98.1% |
| Immigrants | Sweden | 98.9 /100 | #84 | Exceptional 98.1% |
| Immigrants | Australia | 98.9 /100 | #85 | Exceptional 98.1% |
| Potawatomi | 98.9 /100 | #86 | Exceptional 98.1% |
| Immigrants | Denmark | 98.8 /100 | #87 | Exceptional 98.1% |
| Immigrants | India | 98.8 /100 | #88 | Exceptional 98.1% |
| Delaware | 98.8 /100 | #89 | Exceptional 98.1% |
| Zimbabweans | 98.8 /100 | #90 | Exceptional 98.1% |
| Hopi | 98.7 /100 | #91 | Exceptional 98.1% |
Demographics Similar to Greeks by 3rd Grade
In terms of 3rd grade, the demographic groups most similar to Greeks are Slavic (98.3%, a difference of 0.0%), Maltese (98.3%, a difference of 0.0%), Creek (98.2%, a difference of 0.0%), Bulgarian (98.3%, a difference of 0.010%), and American (98.3%, a difference of 0.010%).
| Demographics | Rating | Rank | 3rd Grade |
| Australians | 99.8 /100 | #51 | Exceptional 98.3% |
| Whites/Caucasians | 99.8 /100 | #52 | Exceptional 98.3% |
| Immigrants | Scotland | 99.8 /100 | #53 | Exceptional 98.3% |
| Bulgarians | 99.8 /100 | #54 | Exceptional 98.3% |
| Americans | 99.8 /100 | #55 | Exceptional 98.3% |
| Austrians | 99.8 /100 | #56 | Exceptional 98.3% |
| Slavs | 99.7 /100 | #57 | Exceptional 98.3% |
| Greeks | 99.7 /100 | #58 | Exceptional 98.3% |
| Maltese | 99.7 /100 | #59 | Exceptional 98.3% |
| Creek | 99.7 /100 | #60 | Exceptional 98.2% |
| Pueblo | 99.7 /100 | #61 | Exceptional 98.2% |
| Immigrants | Canada | 99.7 /100 | #62 | Exceptional 98.2% |
| Immigrants | North America | 99.7 /100 | #63 | Exceptional 98.2% |
| Kiowa | 99.6 /100 | #64 | Exceptional 98.2% |
| New Zealanders | 99.6 /100 | #65 | Exceptional 98.2% |