Immigrants from Sri Lanka vs Nonimmigrants Vision Disability
COMPARE
Immigrants from Sri Lanka
Nonimmigrants
Vision Disability
Vision Disability Comparison
Immigrants from Sri Lanka
Nonimmigrants
1.9%
VISION DISABILITY
100.0/ 100
METRIC RATING
19th/ 347
METRIC RANK
2.5%
VISION DISABILITY
0.0/ 100
METRIC RATING
289th/ 347
METRIC RANK
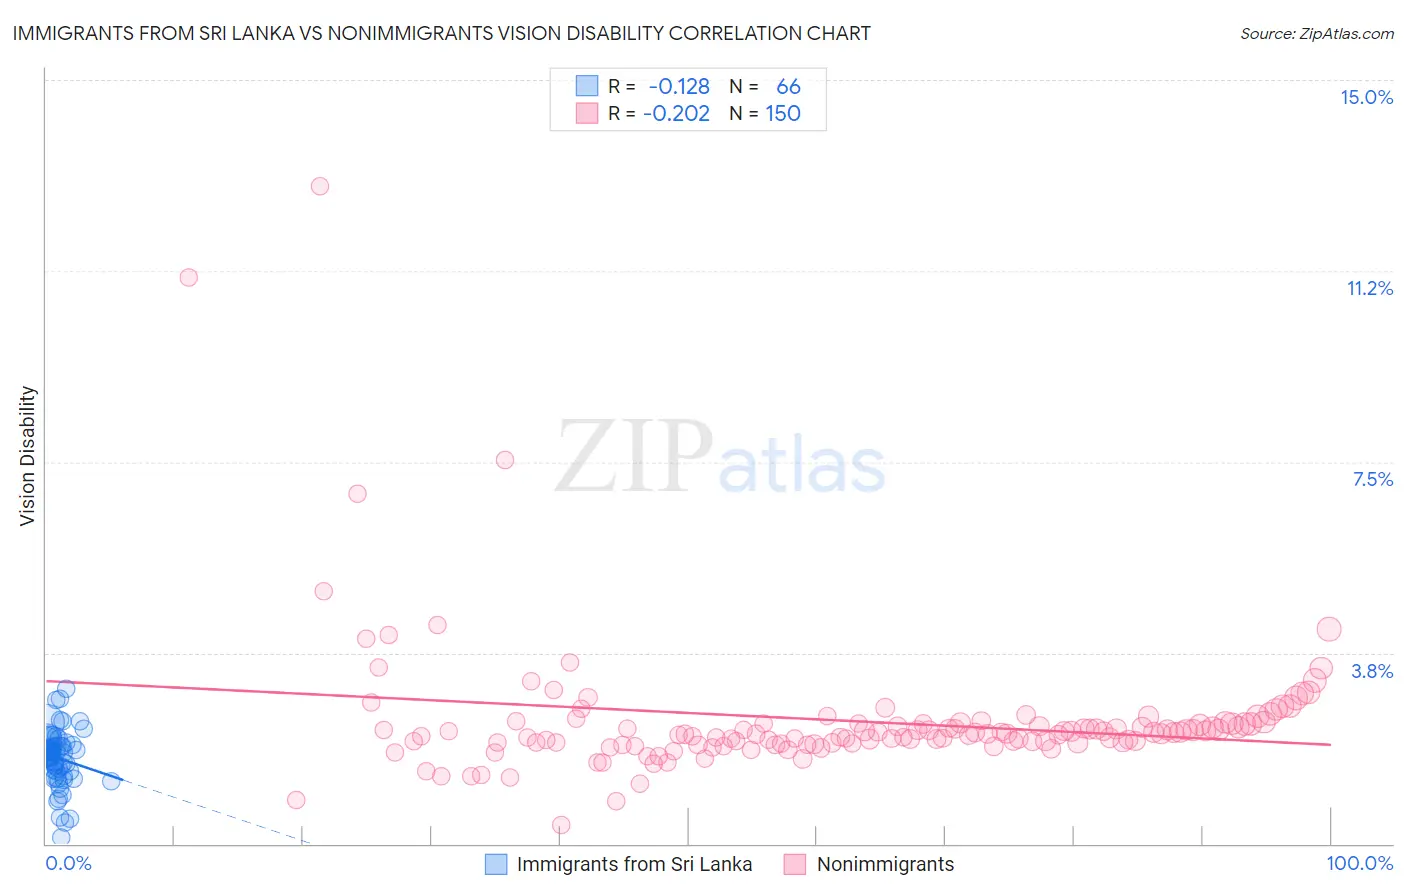
Immigrants from Sri Lanka vs Nonimmigrants Vision Disability Correlation Chart
The statistical analysis conducted on geographies consisting of 149,673,747 people shows a poor negative correlation between the proportion of Immigrants from Sri Lanka and percentage of population with vision disability in the United States with a correlation coefficient (R) of -0.128 and weighted average of 1.9%. Similarly, the statistical analysis conducted on geographies consisting of 581,859,538 people shows a weak negative correlation between the proportion of Nonimmigrants and percentage of population with vision disability in the United States with a correlation coefficient (R) of -0.202 and weighted average of 2.5%, a difference of 31.9%.
Vision Disability Correlation Summary
| Measurement | Immigrants from Sri Lanka | Nonimmigrants |
| Minimum | 0.13% | 0.37% |
| Maximum | 3.0% | 12.9% |
| Range | 2.9% | 12.5% |
| Mean | 1.7% | 2.4% |
| Median | 1.7% | 2.2% |
| Interquartile 25% (IQ1) | 1.4% | 2.0% |
| Interquartile 75% (IQ3) | 1.9% | 2.4% |
| Interquartile Range (IQR) | 0.50% | 0.38% |
| Standard Deviation (Sample) | 0.55% | 1.4% |
| Standard Deviation (Population) | 0.54% | 1.4% |
Similar Demographics by Vision Disability
Demographics Similar to Immigrants from Sri Lanka by Vision Disability
In terms of vision disability, the demographic groups most similar to Immigrants from Sri Lanka are Asian (1.9%, a difference of 1.1%), Bolivian (1.9%, a difference of 1.2%), Turkish (1.9%, a difference of 1.4%), Immigrants from Pakistan (1.9%, a difference of 1.4%), and Indian (Asian) (1.8%, a difference of 1.7%).
| Demographics | Rating | Rank | Vision Disability |
| Immigrants | Korea | 100.0 /100 | #12 | Exceptional 1.8% |
| Immigrants | Eastern Asia | 100.0 /100 | #13 | Exceptional 1.8% |
| Immigrants | China | 100.0 /100 | #14 | Exceptional 1.8% |
| Immigrants | Bolivia | 100.0 /100 | #15 | Exceptional 1.8% |
| Indians (Asian) | 100.0 /100 | #16 | Exceptional 1.8% |
| Burmese | 100.0 /100 | #17 | Exceptional 1.8% |
| Bolivians | 100.0 /100 | #18 | Exceptional 1.9% |
| Immigrants | Sri Lanka | 100.0 /100 | #19 | Exceptional 1.9% |
| Asians | 100.0 /100 | #20 | Exceptional 1.9% |
| Turks | 100.0 /100 | #21 | Exceptional 1.9% |
| Immigrants | Pakistan | 100.0 /100 | #22 | Exceptional 1.9% |
| Immigrants | Asia | 99.9 /100 | #23 | Exceptional 1.9% |
| Immigrants | Lithuania | 99.9 /100 | #24 | Exceptional 1.9% |
| Bulgarians | 99.9 /100 | #25 | Exceptional 1.9% |
| Immigrants | Japan | 99.9 /100 | #26 | Exceptional 1.9% |
Demographics Similar to Nonimmigrants by Vision Disability
In terms of vision disability, the demographic groups most similar to Nonimmigrants are Immigrants from Cuba (2.5%, a difference of 0.14%), French American Indian (2.5%, a difference of 0.41%), Honduran (2.5%, a difference of 0.43%), Immigrants from Honduras (2.5%, a difference of 0.53%), and Sioux (2.5%, a difference of 0.57%).
| Demographics | Rating | Rank | Vision Disability |
| Immigrants | Caribbean | 0.0 /100 | #282 | Tragic 2.5% |
| Puget Sound Salish | 0.0 /100 | #283 | Tragic 2.5% |
| Yakama | 0.0 /100 | #284 | Tragic 2.5% |
| Immigrants | Central America | 0.0 /100 | #285 | Tragic 2.5% |
| Sioux | 0.0 /100 | #286 | Tragic 2.5% |
| Hondurans | 0.0 /100 | #287 | Tragic 2.5% |
| French American Indians | 0.0 /100 | #288 | Tragic 2.5% |
| Immigrants | Nonimmigrants | 0.0 /100 | #289 | Tragic 2.5% |
| Immigrants | Cuba | 0.0 /100 | #290 | Tragic 2.5% |
| Immigrants | Honduras | 0.0 /100 | #291 | Tragic 2.5% |
| Crow | 0.0 /100 | #292 | Tragic 2.5% |
| Yaqui | 0.0 /100 | #293 | Tragic 2.5% |
| Ottawa | 0.0 /100 | #294 | Tragic 2.5% |
| Delaware | 0.0 /100 | #295 | Tragic 2.5% |
| Immigrants | Mexico | 0.0 /100 | #296 | Tragic 2.5% |