Sierra Leonean vs Pakistani Hearing Disability
COMPARE
Sierra Leonean
Pakistani
Hearing Disability
Hearing Disability Comparison
Sierra Leoneans
Pakistanis
2.5%
HEARING DISABILITY
99.9/ 100
METRIC RATING
13th/ 347
METRIC RANK
3.1%
HEARING DISABILITY
11.1/ 100
METRIC RATING
212th/ 347
METRIC RANK
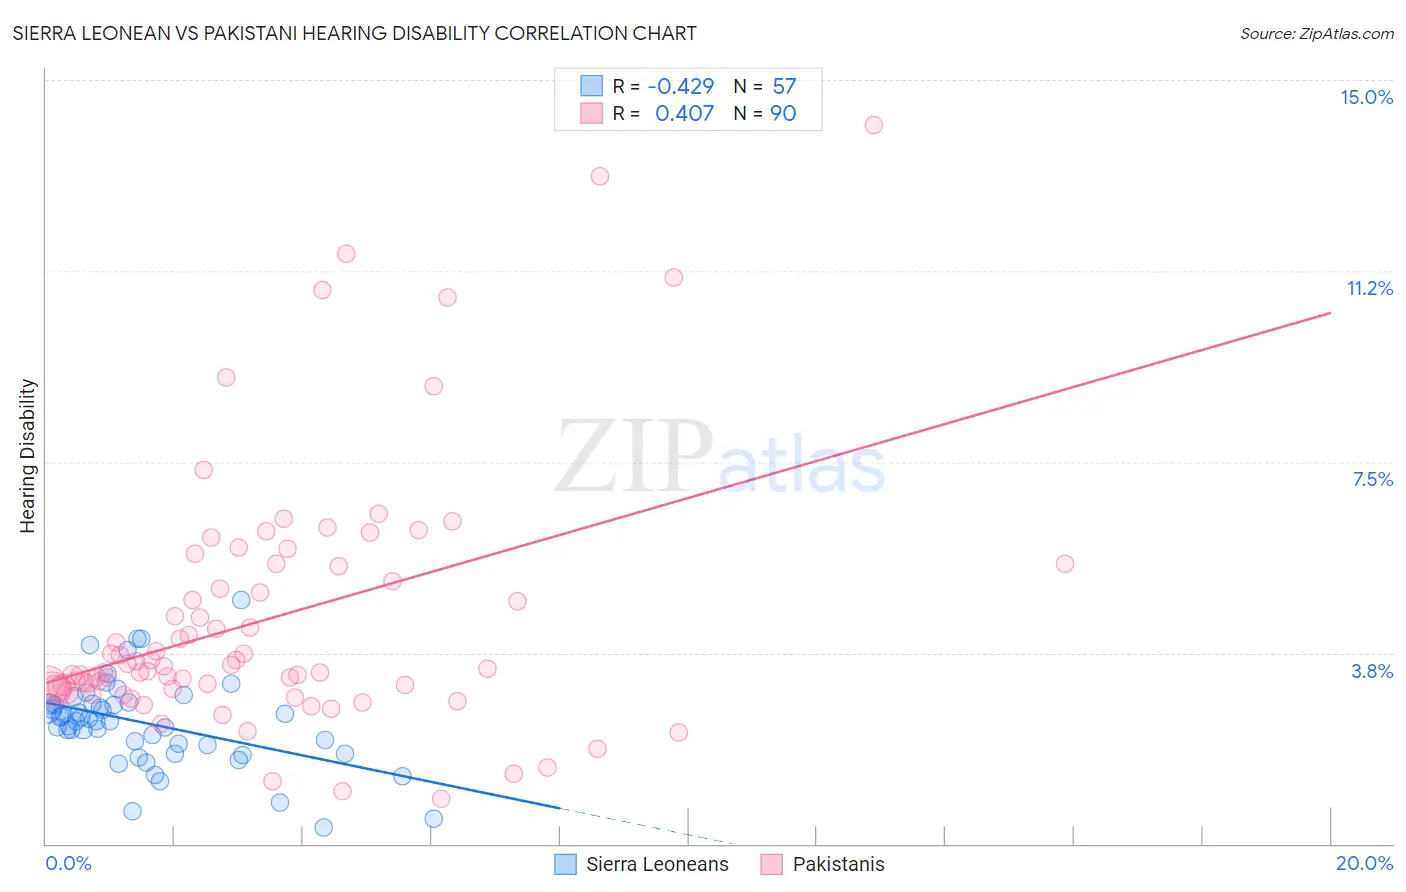
Sierra Leonean vs Pakistani Hearing Disability Correlation Chart
The statistical analysis conducted on geographies consisting of 83,339,030 people shows a moderate negative correlation between the proportion of Sierra Leoneans and percentage of population with hearing disability in the United States with a correlation coefficient (R) of -0.429 and weighted average of 2.5%. Similarly, the statistical analysis conducted on geographies consisting of 335,217,185 people shows a moderate positive correlation between the proportion of Pakistanis and percentage of population with hearing disability in the United States with a correlation coefficient (R) of 0.407 and weighted average of 3.1%, a difference of 25.6%.
Hearing Disability Correlation Summary
| Measurement | Sierra Leonean | Pakistani |
| Minimum | 0.31% | 0.88% |
| Maximum | 4.8% | 14.1% |
| Range | 4.5% | 13.2% |
| Mean | 2.4% | 4.4% |
| Median | 2.4% | 3.5% |
| Interquartile 25% (IQ1) | 1.9% | 3.0% |
| Interquartile 75% (IQ3) | 2.8% | 5.4% |
| Interquartile Range (IQR) | 0.89% | 2.4% |
| Standard Deviation (Sample) | 0.86% | 2.6% |
| Standard Deviation (Population) | 0.85% | 2.5% |
Similar Demographics by Hearing Disability
Demographics Similar to Sierra Leoneans by Hearing Disability
In terms of hearing disability, the demographic groups most similar to Sierra Leoneans are Trinidadian and Tobagonian (2.5%, a difference of 0.22%), Ecuadorian (2.5%, a difference of 0.32%), Immigrants from Trinidad and Tobago (2.5%, a difference of 0.53%), Barbadian (2.5%, a difference of 0.62%), and Immigrants from West Indies (2.5%, a difference of 0.77%).
| Demographics | Rating | Rank | Hearing Disability |
| Vietnamese | 100.0 /100 | #6 | Exceptional 2.4% |
| Immigrants | Bangladesh | 100.0 /100 | #7 | Exceptional 2.4% |
| British West Indians | 100.0 /100 | #8 | Exceptional 2.4% |
| Immigrants | Dominican Republic | 100.0 /100 | #9 | Exceptional 2.4% |
| Immigrants | Ecuador | 99.9 /100 | #10 | Exceptional 2.5% |
| Immigrants | Trinidad and Tobago | 99.9 /100 | #11 | Exceptional 2.5% |
| Trinidadians and Tobagonians | 99.9 /100 | #12 | Exceptional 2.5% |
| Sierra Leoneans | 99.9 /100 | #13 | Exceptional 2.5% |
| Ecuadorians | 99.9 /100 | #14 | Exceptional 2.5% |
| Barbadians | 99.9 /100 | #15 | Exceptional 2.5% |
| Immigrants | West Indies | 99.9 /100 | #16 | Exceptional 2.5% |
| Immigrants | India | 99.9 /100 | #17 | Exceptional 2.5% |
| Dominicans | 99.8 /100 | #18 | Exceptional 2.5% |
| Thais | 99.8 /100 | #19 | Exceptional 2.5% |
| Immigrants | Bolivia | 99.8 /100 | #20 | Exceptional 2.5% |
Demographics Similar to Pakistanis by Hearing Disability
In terms of hearing disability, the demographic groups most similar to Pakistanis are Immigrants from Iraq (3.1%, a difference of 0.15%), Romanian (3.1%, a difference of 0.21%), Cape Verdean (3.1%, a difference of 0.25%), Immigrants from Hungary (3.1%, a difference of 0.29%), and Immigrants from Latvia (3.1%, a difference of 0.33%).
| Demographics | Rating | Rank | Hearing Disability |
| Alsatians | 15.9 /100 | #205 | Poor 3.1% |
| Eastern Europeans | 15.5 /100 | #206 | Poor 3.1% |
| Hispanics or Latinos | 15.1 /100 | #207 | Poor 3.1% |
| Immigrants | Latvia | 12.7 /100 | #208 | Poor 3.1% |
| Immigrants | Hungary | 12.5 /100 | #209 | Poor 3.1% |
| Cape Verdeans | 12.2 /100 | #210 | Poor 3.1% |
| Romanians | 12.1 /100 | #211 | Poor 3.1% |
| Pakistanis | 11.1 /100 | #212 | Poor 3.1% |
| Immigrants | Iraq | 10.5 /100 | #213 | Poor 3.1% |
| Australians | 8.1 /100 | #214 | Tragic 3.2% |
| Bangladeshis | 8.1 /100 | #215 | Tragic 3.2% |
| Immigrants | Norway | 7.3 /100 | #216 | Tragic 3.2% |
| Russians | 7.1 /100 | #217 | Tragic 3.2% |
| Immigrants | Northern Europe | 7.0 /100 | #218 | Tragic 3.2% |
| New Zealanders | 6.8 /100 | #219 | Tragic 3.2% |