Immigrants from South Central Asia vs Immigrants from Guyana Householder Income Ages 45 - 64 years
COMPARE
Immigrants from South Central Asia
Immigrants from Guyana
Householder Income Ages 45 - 64 years
Householder Income Ages 45 - 64 years Comparison
Immigrants from South Central Asia
Immigrants from Guyana
$124,188
HOUSEHOLDER INCOME AGES 45 - 64 YEARS
100.0/ 100
METRIC RATING
10th/ 347
METRIC RANK
$90,186
HOUSEHOLDER INCOME AGES 45 - 64 YEARS
0.6/ 100
METRIC RATING
254th/ 347
METRIC RANK
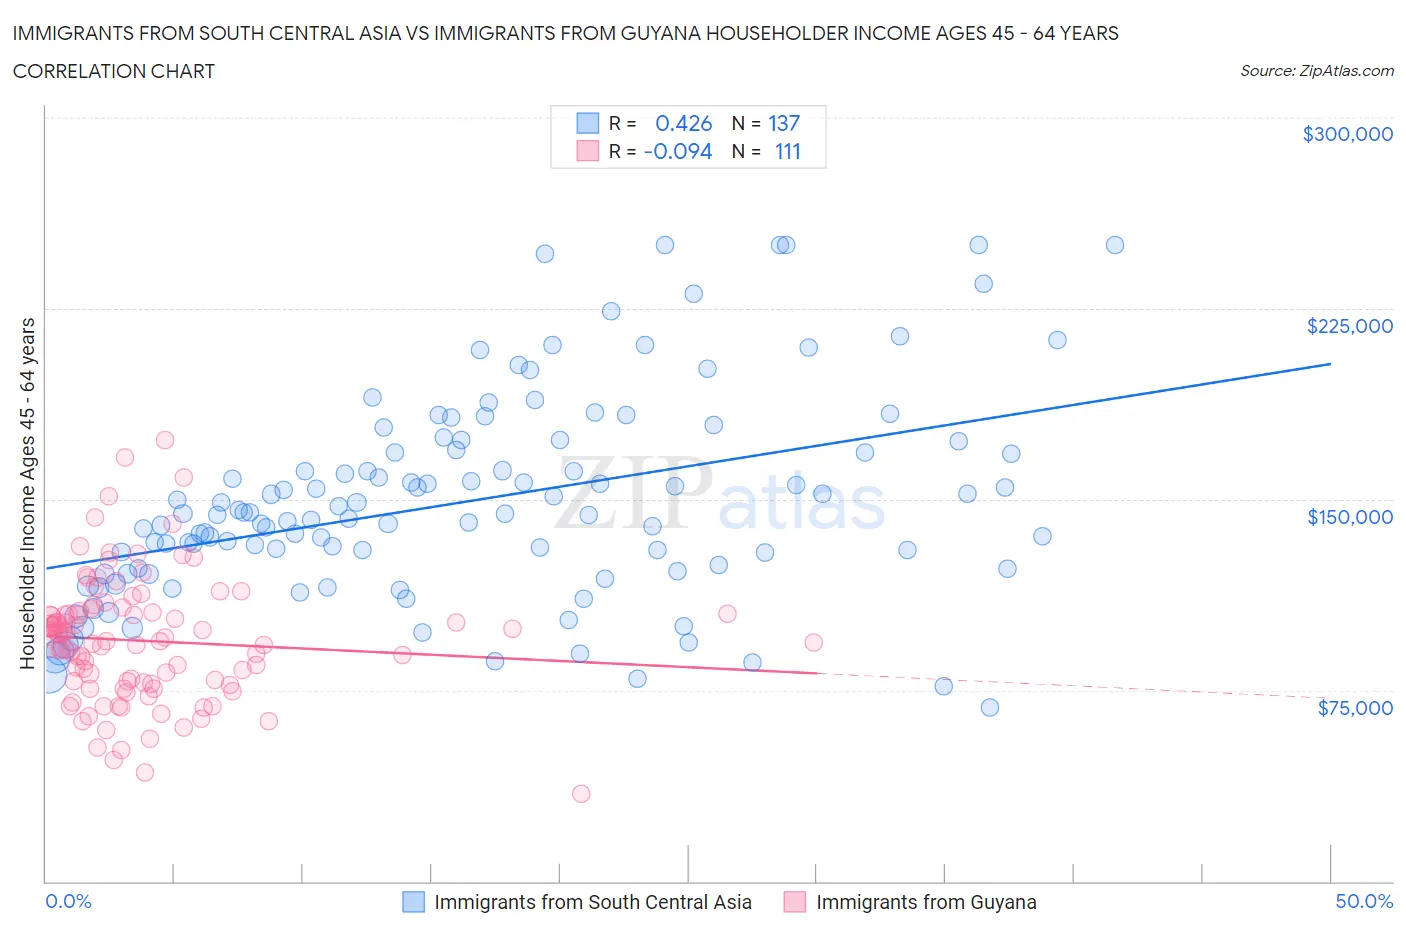
Immigrants from South Central Asia vs Immigrants from Guyana Householder Income Ages 45 - 64 years Correlation Chart
The statistical analysis conducted on geographies consisting of 471,929,407 people shows a moderate positive correlation between the proportion of Immigrants from South Central Asia and household income with householder between the ages 45 and 64 in the United States with a correlation coefficient (R) of 0.426 and weighted average of $124,188. Similarly, the statistical analysis conducted on geographies consisting of 183,608,154 people shows a slight negative correlation between the proportion of Immigrants from Guyana and household income with householder between the ages 45 and 64 in the United States with a correlation coefficient (R) of -0.094 and weighted average of $90,186, a difference of 37.7%.
Householder Income Ages 45 - 64 years Correlation Summary
| Measurement | Immigrants from South Central Asia | Immigrants from Guyana |
| Minimum | $68,125 | $34,531 |
| Maximum | $250,001 | $173,438 |
| Range | $181,876 | $138,907 |
| Mean | $148,894 | $94,395 |
| Median | $144,037 | $94,422 |
| Interquartile 25% (IQ1) | $122,225 | $77,393 |
| Interquartile 75% (IQ3) | $168,955 | $105,417 |
| Interquartile Range (IQR) | $46,731 | $28,024 |
| Standard Deviation (Sample) | $40,252 | $24,856 |
| Standard Deviation (Population) | $40,105 | $24,743 |
Similar Demographics by Householder Income Ages 45 - 64 years
Demographics Similar to Immigrants from South Central Asia by Householder Income Ages 45 - 64 years
In terms of householder income ages 45 - 64 years, the demographic groups most similar to Immigrants from South Central Asia are Okinawan ($124,796, a difference of 0.49%), Cypriot ($123,396, a difference of 0.64%), Immigrants from Israel ($122,893, a difference of 1.1%), Immigrants from Ireland ($122,757, a difference of 1.2%), and Indian (Asian) ($122,343, a difference of 1.5%).
| Demographics | Rating | Rank | Householder Income Ages 45 - 64 years |
| Immigrants | India | 100.0 /100 | #3 | Exceptional $132,488 |
| Thais | 100.0 /100 | #4 | Exceptional $129,560 |
| Immigrants | Singapore | 100.0 /100 | #5 | Exceptional $129,514 |
| Iranians | 100.0 /100 | #6 | Exceptional $129,350 |
| Immigrants | Hong Kong | 100.0 /100 | #7 | Exceptional $127,500 |
| Immigrants | Iran | 100.0 /100 | #8 | Exceptional $126,940 |
| Okinawans | 100.0 /100 | #9 | Exceptional $124,796 |
| Immigrants | South Central Asia | 100.0 /100 | #10 | Exceptional $124,188 |
| Cypriots | 100.0 /100 | #11 | Exceptional $123,396 |
| Immigrants | Israel | 100.0 /100 | #12 | Exceptional $122,893 |
| Immigrants | Ireland | 100.0 /100 | #13 | Exceptional $122,757 |
| Indians (Asian) | 100.0 /100 | #14 | Exceptional $122,343 |
| Immigrants | Eastern Asia | 100.0 /100 | #15 | Exceptional $122,222 |
| Immigrants | China | 100.0 /100 | #16 | Exceptional $122,178 |
| Burmese | 100.0 /100 | #17 | Exceptional $121,444 |
Demographics Similar to Immigrants from Guyana by Householder Income Ages 45 - 64 years
In terms of householder income ages 45 - 64 years, the demographic groups most similar to Immigrants from Guyana are Barbadian ($90,266, a difference of 0.090%), Marshallese ($90,455, a difference of 0.30%), West Indian ($89,906, a difference of 0.31%), American ($90,536, a difference of 0.39%), and French American Indian ($89,811, a difference of 0.42%).
| Demographics | Rating | Rank | Householder Income Ages 45 - 64 years |
| Alaskan Athabascans | 0.9 /100 | #247 | Tragic $90,951 |
| Immigrants | Laos | 0.9 /100 | #248 | Tragic $90,909 |
| Mexican American Indians | 0.8 /100 | #249 | Tragic $90,811 |
| Sub-Saharan Africans | 0.8 /100 | #250 | Tragic $90,691 |
| Americans | 0.7 /100 | #251 | Tragic $90,536 |
| Marshallese | 0.7 /100 | #252 | Tragic $90,455 |
| Barbadians | 0.6 /100 | #253 | Tragic $90,266 |
| Immigrants | Guyana | 0.6 /100 | #254 | Tragic $90,186 |
| West Indians | 0.5 /100 | #255 | Tragic $89,906 |
| French American Indians | 0.5 /100 | #256 | Tragic $89,811 |
| German Russians | 0.4 /100 | #257 | Tragic $89,398 |
| Immigrants | Barbados | 0.4 /100 | #258 | Tragic $89,394 |
| Immigrants | Nicaragua | 0.4 /100 | #259 | Tragic $89,108 |
| Liberians | 0.3 /100 | #260 | Tragic $88,929 |
| Belizeans | 0.3 /100 | #261 | Tragic $88,684 |