Immigrants from Belize vs Immigrants from Guyana Disability
COMPARE
Immigrants from Belize
Immigrants from Guyana
Disability
Disability Comparison
Immigrants from Belize
Immigrants from Guyana
11.9%
DISABILITY
15.2/ 100
METRIC RATING
197th/ 347
METRIC RANK
11.4%
DISABILITY
88.3/ 100
METRIC RATING
134th/ 347
METRIC RANK
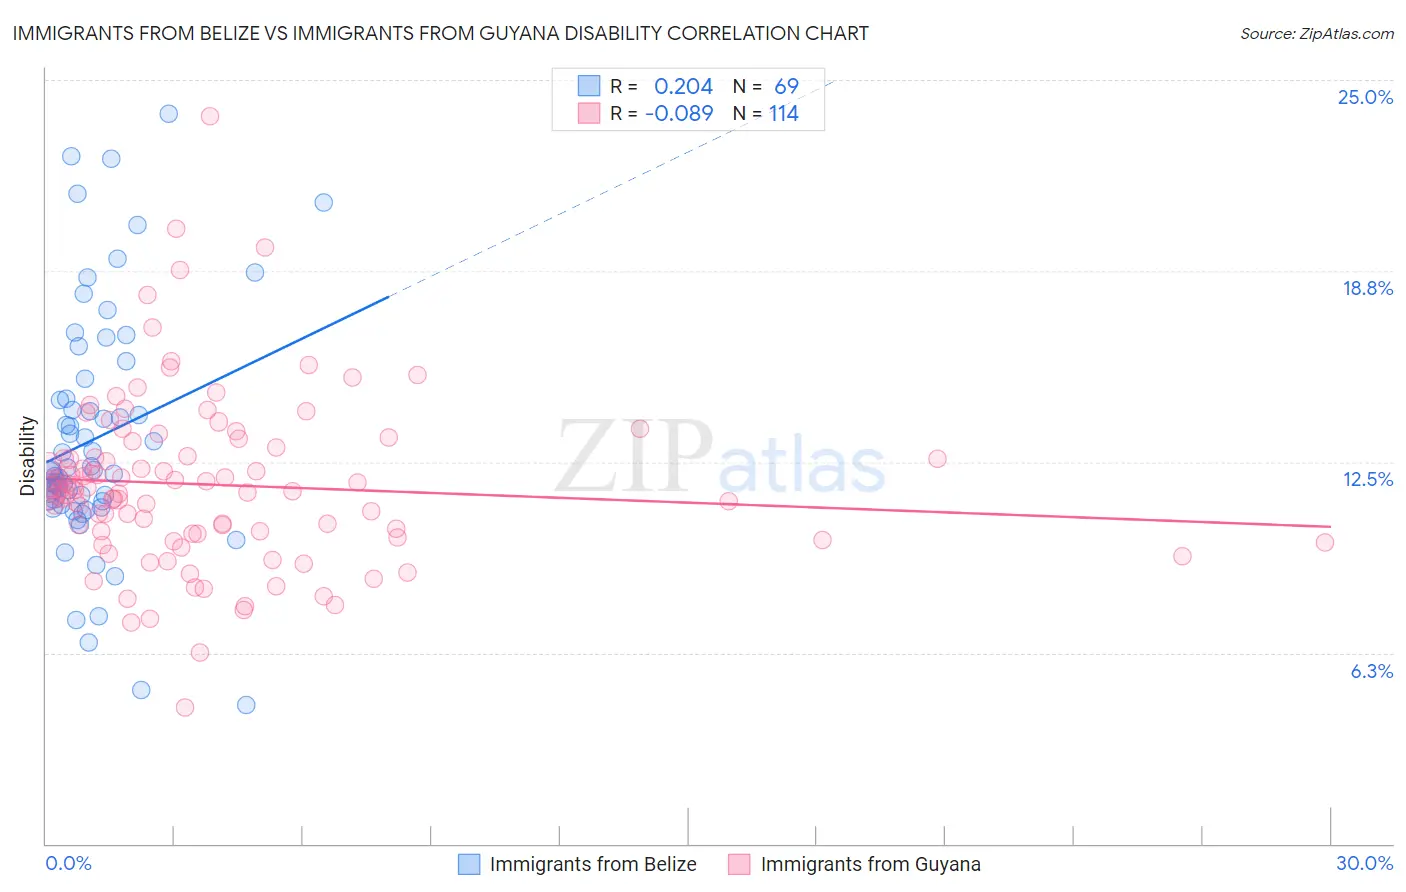
Immigrants from Belize vs Immigrants from Guyana Disability Correlation Chart
The statistical analysis conducted on geographies consisting of 130,304,390 people shows a weak positive correlation between the proportion of Immigrants from Belize and percentage of population with a disability in the United States with a correlation coefficient (R) of 0.204 and weighted average of 11.9%. Similarly, the statistical analysis conducted on geographies consisting of 183,715,267 people shows a slight negative correlation between the proportion of Immigrants from Guyana and percentage of population with a disability in the United States with a correlation coefficient (R) of -0.089 and weighted average of 11.4%, a difference of 4.2%.
Disability Correlation Summary
| Measurement | Immigrants from Belize | Immigrants from Guyana |
| Minimum | 4.5% | 4.4% |
| Maximum | 23.9% | 23.8% |
| Range | 19.4% | 19.4% |
| Mean | 13.3% | 11.8% |
| Median | 12.2% | 11.6% |
| Interquartile 25% (IQ1) | 11.2% | 10.1% |
| Interquartile 75% (IQ3) | 14.9% | 13.0% |
| Interquartile Range (IQR) | 3.8% | 2.8% |
| Standard Deviation (Sample) | 4.0% | 2.8% |
| Standard Deviation (Population) | 3.9% | 2.8% |
Similar Demographics by Disability
Demographics Similar to Immigrants from Belize by Disability
In terms of disability, the demographic groups most similar to Immigrants from Belize are Serbian (11.9%, a difference of 0.010%), Barbadian (11.9%, a difference of 0.050%), Ukrainian (11.9%, a difference of 0.050%), Immigrants from Panama (11.9%, a difference of 0.050%), and Somali (11.9%, a difference of 0.17%).
| Demographics | Rating | Rank | Disability |
| Immigrants | West Indies | 21.1 /100 | #190 | Fair 11.9% |
| Ute | 19.5 /100 | #191 | Poor 11.9% |
| Lithuanians | 18.8 /100 | #192 | Poor 11.9% |
| Immigrants | Bosnia and Herzegovina | 18.0 /100 | #193 | Poor 11.9% |
| Somalis | 17.3 /100 | #194 | Poor 11.9% |
| Barbadians | 15.8 /100 | #195 | Poor 11.9% |
| Serbians | 15.4 /100 | #196 | Poor 11.9% |
| Immigrants | Belize | 15.2 /100 | #197 | Poor 11.9% |
| Ukrainians | 14.7 /100 | #198 | Poor 11.9% |
| Immigrants | Panama | 14.6 /100 | #199 | Poor 11.9% |
| Belizeans | 12.8 /100 | #200 | Poor 11.9% |
| Assyrians/Chaldeans/Syriacs | 12.6 /100 | #201 | Poor 11.9% |
| Immigrants | England | 12.0 /100 | #202 | Poor 12.0% |
| British West Indians | 11.5 /100 | #203 | Poor 12.0% |
| Mexican American Indians | 11.4 /100 | #204 | Poor 12.0% |
Demographics Similar to Immigrants from Guyana by Disability
In terms of disability, the demographic groups most similar to Immigrants from Guyana are Ugandan (11.4%, a difference of 0.050%), Immigrants from St. Vincent and the Grenadines (11.4%, a difference of 0.060%), Arab (11.4%, a difference of 0.080%), Immigrants from Africa (11.4%, a difference of 0.11%), and Kenyan (11.5%, a difference of 0.13%).
| Demographics | Rating | Rank | Disability |
| Immigrants | Italy | 90.4 /100 | #127 | Exceptional 11.4% |
| Immigrants | Europe | 90.4 /100 | #128 | Exceptional 11.4% |
| Macedonians | 90.3 /100 | #129 | Exceptional 11.4% |
| Latvians | 89.8 /100 | #130 | Excellent 11.4% |
| Immigrants | Croatia | 89.8 /100 | #131 | Excellent 11.4% |
| Immigrants | Africa | 89.3 /100 | #132 | Excellent 11.4% |
| Arabs | 89.1 /100 | #133 | Excellent 11.4% |
| Immigrants | Guyana | 88.3 /100 | #134 | Excellent 11.4% |
| Ugandans | 87.9 /100 | #135 | Excellent 11.4% |
| Immigrants | St. Vincent and the Grenadines | 87.8 /100 | #136 | Excellent 11.4% |
| Kenyans | 87.1 /100 | #137 | Excellent 11.5% |
| New Zealanders | 87.0 /100 | #138 | Excellent 11.5% |
| Ghanaians | 87.0 /100 | #139 | Excellent 11.5% |
| Russians | 86.8 /100 | #140 | Excellent 11.5% |
| Immigrants | Grenada | 86.1 /100 | #141 | Excellent 11.5% |