Immigrants from South Central Asia vs Immigrants from the Azores Disability Age 65 to 74
COMPARE
Immigrants from South Central Asia
Immigrants from the Azores
Disability Age 65 to 74
Disability Age 65 to 74 Comparison
Immigrants from South Central Asia
Immigrants from the Azores
20.6%
DISABILITY AGE 65 TO 74
100.0/ 100
METRIC RATING
17th/ 347
METRIC RANK
26.0%
DISABILITY AGE 65 TO 74
0.0/ 100
METRIC RATING
284th/ 347
METRIC RANK
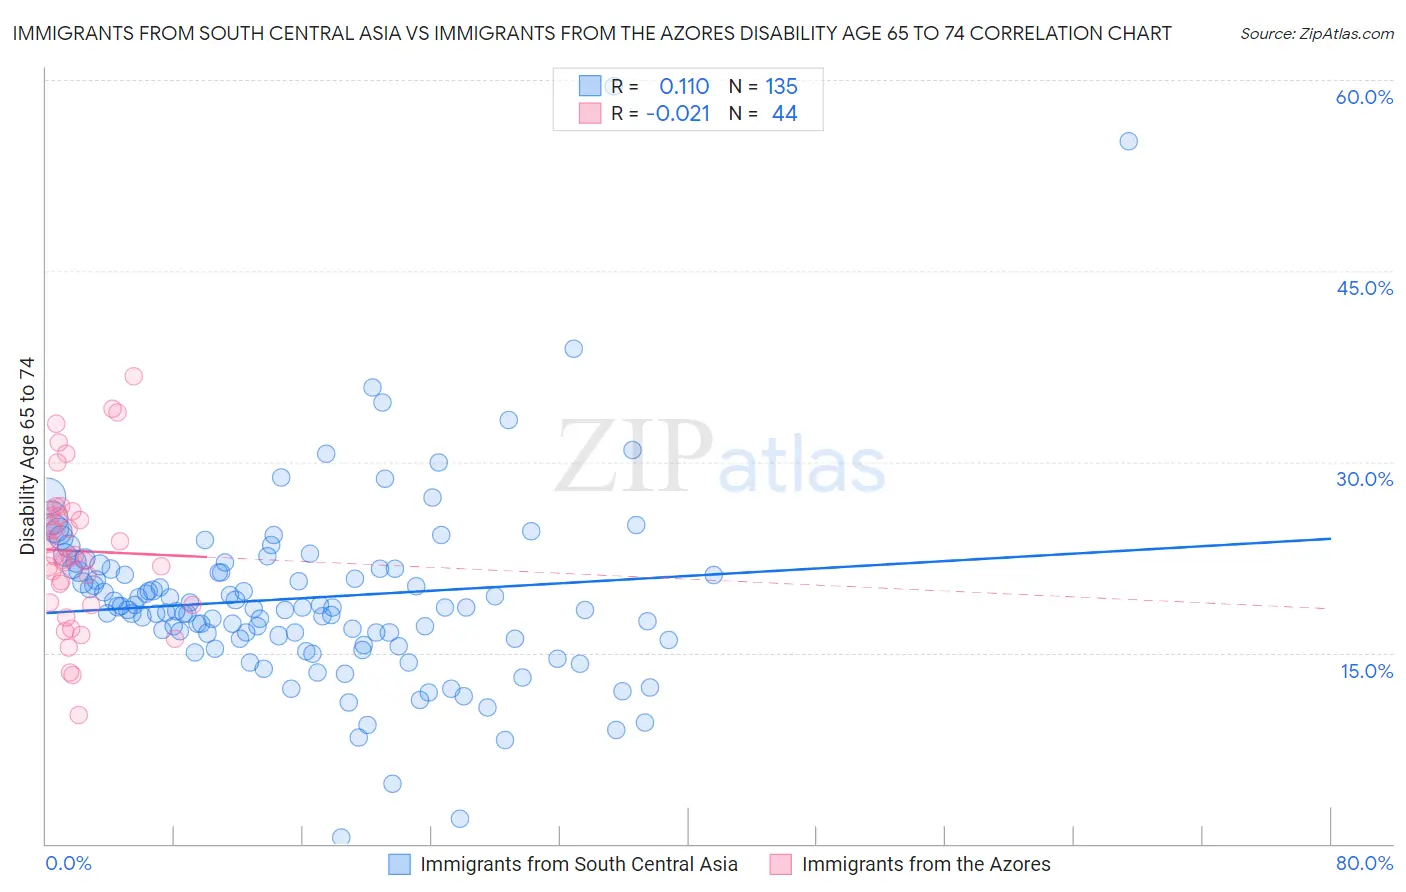
Immigrants from South Central Asia vs Immigrants from the Azores Disability Age 65 to 74 Correlation Chart
The statistical analysis conducted on geographies consisting of 471,844,047 people shows a poor positive correlation between the proportion of Immigrants from South Central Asia and percentage of population with a disability between the ages 65 and 75 in the United States with a correlation coefficient (R) of 0.110 and weighted average of 20.6%. Similarly, the statistical analysis conducted on geographies consisting of 46,238,096 people shows no correlation between the proportion of Immigrants from the Azores and percentage of population with a disability between the ages 65 and 75 in the United States with a correlation coefficient (R) of -0.021 and weighted average of 26.0%, a difference of 26.2%.
Disability Age 65 to 74 Correlation Summary
| Measurement | Immigrants from South Central Asia | Immigrants from the Azores |
| Minimum | 0.50% | 10.1% |
| Maximum | 59.5% | 36.7% |
| Range | 59.0% | 26.6% |
| Mean | 19.3% | 23.0% |
| Median | 18.5% | 22.6% |
| Interquartile 25% (IQ1) | 16.1% | 18.9% |
| Interquartile 75% (IQ3) | 21.6% | 25.9% |
| Interquartile Range (IQR) | 5.5% | 7.1% |
| Standard Deviation (Sample) | 7.5% | 5.8% |
| Standard Deviation (Population) | 7.5% | 5.8% |
Similar Demographics by Disability Age 65 to 74
Demographics Similar to Immigrants from South Central Asia by Disability Age 65 to 74
In terms of disability age 65 to 74, the demographic groups most similar to Immigrants from South Central Asia are Eastern European (20.6%, a difference of 0.070%), Burmese (20.6%, a difference of 0.10%), Immigrants from Lithuania (20.5%, a difference of 0.25%), Paraguayan (20.5%, a difference of 0.31%), and Indian (Asian) (20.5%, a difference of 0.33%).
| Demographics | Rating | Rank | Disability Age 65 to 74 |
| Immigrants | Eastern Asia | 100.0 /100 | #10 | Exceptional 20.3% |
| Immigrants | Ireland | 100.0 /100 | #11 | Exceptional 20.3% |
| Immigrants | Korea | 100.0 /100 | #12 | Exceptional 20.4% |
| Immigrants | Singapore | 100.0 /100 | #13 | Exceptional 20.4% |
| Indians (Asian) | 100.0 /100 | #14 | Exceptional 20.5% |
| Paraguayans | 100.0 /100 | #15 | Exceptional 20.5% |
| Immigrants | Lithuania | 100.0 /100 | #16 | Exceptional 20.5% |
| Immigrants | South Central Asia | 100.0 /100 | #17 | Exceptional 20.6% |
| Eastern Europeans | 100.0 /100 | #18 | Exceptional 20.6% |
| Burmese | 100.0 /100 | #19 | Exceptional 20.6% |
| Okinawans | 100.0 /100 | #20 | Exceptional 20.7% |
| Immigrants | Bolivia | 99.9 /100 | #21 | Exceptional 20.8% |
| Immigrants | Iran | 99.9 /100 | #22 | Exceptional 20.9% |
| Immigrants | Belgium | 99.9 /100 | #23 | Exceptional 21.0% |
| Soviet Union | 99.9 /100 | #24 | Exceptional 21.0% |
Demographics Similar to Immigrants from the Azores by Disability Age 65 to 74
In terms of disability age 65 to 74, the demographic groups most similar to Immigrants from the Azores are Immigrants from Congo (26.0%, a difference of 0.020%), Spanish American (25.9%, a difference of 0.19%), Delaware (25.9%, a difference of 0.33%), Immigrants from Honduras (25.9%, a difference of 0.40%), and Cree (25.9%, a difference of 0.42%).
| Demographics | Rating | Rank | Disability Age 65 to 74 |
| Belizeans | 0.1 /100 | #277 | Tragic 25.8% |
| Immigrants | Belize | 0.1 /100 | #278 | Tragic 25.8% |
| U.S. Virgin Islanders | 0.1 /100 | #279 | Tragic 25.9% |
| Cree | 0.1 /100 | #280 | Tragic 25.9% |
| Immigrants | Honduras | 0.1 /100 | #281 | Tragic 25.9% |
| Delaware | 0.1 /100 | #282 | Tragic 25.9% |
| Spanish Americans | 0.0 /100 | #283 | Tragic 25.9% |
| Immigrants | Azores | 0.0 /100 | #284 | Tragic 26.0% |
| Immigrants | Congo | 0.0 /100 | #285 | Tragic 26.0% |
| Immigrants | Micronesia | 0.0 /100 | #286 | Tragic 26.1% |
| Immigrants | Laos | 0.0 /100 | #287 | Tragic 26.1% |
| Mexican American Indians | 0.0 /100 | #288 | Tragic 26.2% |
| Africans | 0.0 /100 | #289 | Tragic 26.2% |
| Immigrants | Cabo Verde | 0.0 /100 | #290 | Tragic 26.3% |
| Spanish American Indians | 0.0 /100 | #291 | Tragic 26.4% |