Immigrants from South Africa vs Alaskan Athabascan Disability Age Over 75
COMPARE
Immigrants from South Africa
Alaskan Athabascan
Disability Age Over 75
Disability Age Over 75 Comparison
Immigrants from South Africa
Alaskan Athabascans
45.3%
DISABILITY AGE OVER 75
100.0/ 100
METRIC RATING
22nd/ 347
METRIC RANK
54.0%
DISABILITY AGE OVER 75
0.0/ 100
METRIC RATING
334th/ 347
METRIC RANK
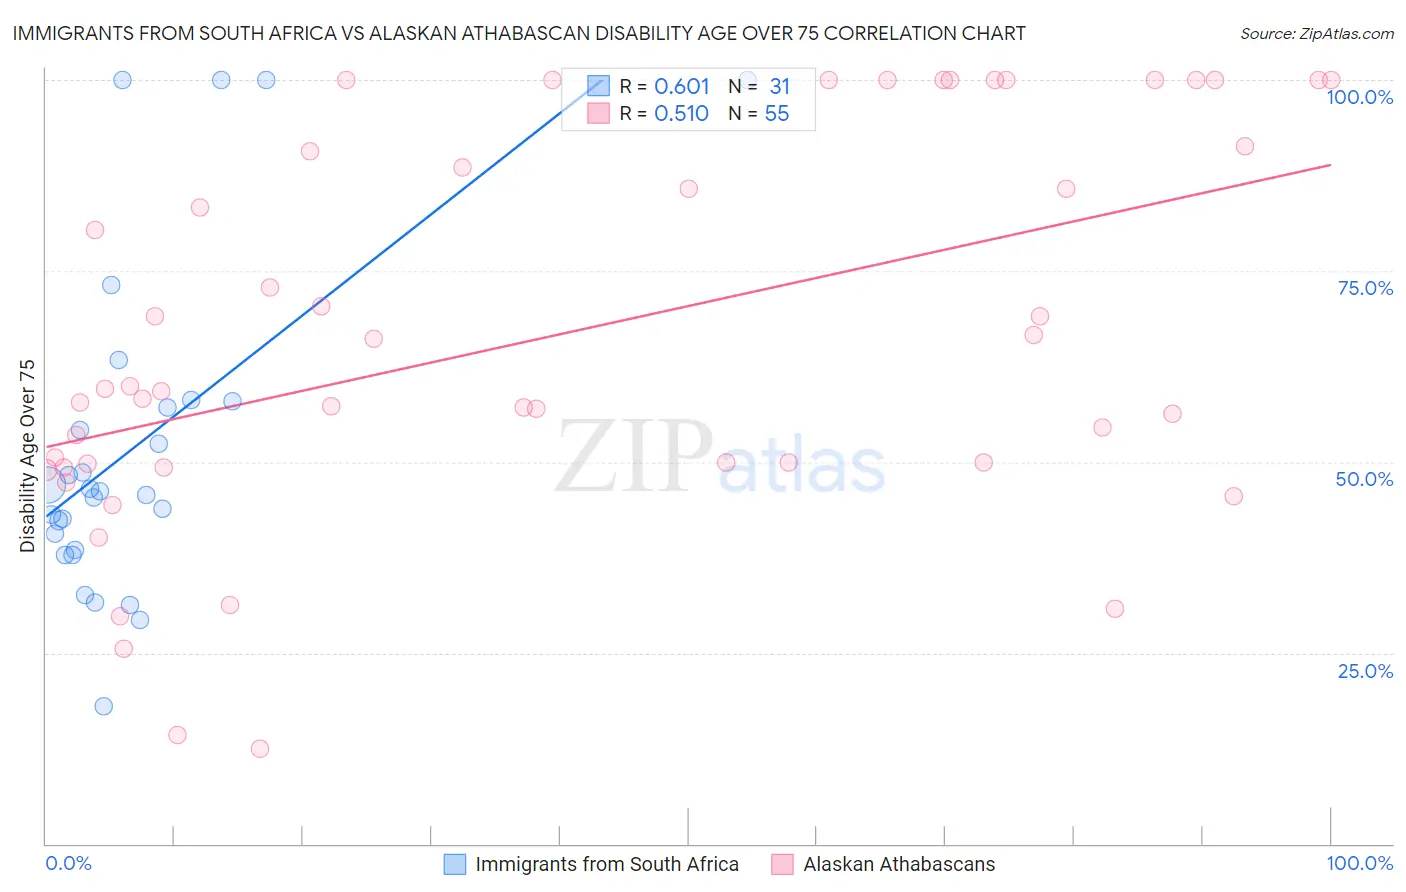
Immigrants from South Africa vs Alaskan Athabascan Disability Age Over 75 Correlation Chart
The statistical analysis conducted on geographies consisting of 233,155,609 people shows a significant positive correlation between the proportion of Immigrants from South Africa and percentage of population with a disability over the age of 75 in the United States with a correlation coefficient (R) of 0.601 and weighted average of 45.3%. Similarly, the statistical analysis conducted on geographies consisting of 45,799,271 people shows a substantial positive correlation between the proportion of Alaskan Athabascans and percentage of population with a disability over the age of 75 in the United States with a correlation coefficient (R) of 0.510 and weighted average of 54.0%, a difference of 19.0%.
Disability Age Over 75 Correlation Summary
| Measurement | Immigrants from South Africa | Alaskan Athabascan |
| Minimum | 18.0% | 12.5% |
| Maximum | 100.0% | 100.0% |
| Range | 82.0% | 87.5% |
| Mean | 52.0% | 66.7% |
| Median | 46.2% | 59.6% |
| Interquartile 25% (IQ1) | 38.5% | 49.8% |
| Interquartile 75% (IQ3) | 57.9% | 91.3% |
| Interquartile Range (IQR) | 19.4% | 41.5% |
| Standard Deviation (Sample) | 21.6% | 25.1% |
| Standard Deviation (Population) | 21.3% | 24.8% |
Similar Demographics by Disability Age Over 75
Demographics Similar to Immigrants from South Africa by Disability Age Over 75
In terms of disability age over 75, the demographic groups most similar to Immigrants from South Africa are Immigrants from Belgium (45.3%, a difference of 0.030%), Immigrants from Switzerland (45.3%, a difference of 0.030%), Polish (45.3%, a difference of 0.050%), Immigrants from Bolivia (45.4%, a difference of 0.10%), and Macedonian (45.4%, a difference of 0.13%).
| Demographics | Rating | Rank | Disability Age Over 75 |
| Immigrants | Sweden | 100.0 /100 | #15 | Exceptional 45.1% |
| Immigrants | Northern Europe | 100.0 /100 | #16 | Exceptional 45.2% |
| Immigrants | India | 100.0 /100 | #17 | Exceptional 45.2% |
| Bolivians | 100.0 /100 | #18 | Exceptional 45.2% |
| Immigrants | Greece | 100.0 /100 | #19 | Exceptional 45.2% |
| Immigrants | Serbia | 100.0 /100 | #20 | Exceptional 45.3% |
| Immigrants | Belgium | 100.0 /100 | #21 | Exceptional 45.3% |
| Immigrants | South Africa | 100.0 /100 | #22 | Exceptional 45.3% |
| Immigrants | Switzerland | 99.9 /100 | #23 | Exceptional 45.3% |
| Poles | 99.9 /100 | #24 | Exceptional 45.3% |
| Immigrants | Bolivia | 99.9 /100 | #25 | Exceptional 45.4% |
| Macedonians | 99.9 /100 | #26 | Exceptional 45.4% |
| Immigrants | Poland | 99.9 /100 | #27 | Exceptional 45.4% |
| Thais | 99.9 /100 | #28 | Exceptional 45.4% |
| Filipinos | 99.9 /100 | #29 | Exceptional 45.4% |
Demographics Similar to Alaskan Athabascans by Disability Age Over 75
In terms of disability age over 75, the demographic groups most similar to Alaskan Athabascans are Kiowa (54.2%, a difference of 0.53%), Apache (53.6%, a difference of 0.67%), Immigrants from Armenia (54.3%, a difference of 0.69%), Yuman (54.4%, a difference of 0.85%), and Native/Alaskan (53.1%, a difference of 1.7%).
| Demographics | Rating | Rank | Disability Age Over 75 |
| Nepalese | 0.0 /100 | #327 | Tragic 52.6% |
| Choctaw | 0.0 /100 | #328 | Tragic 52.7% |
| Alaska Natives | 0.0 /100 | #329 | Tragic 52.8% |
| Puerto Ricans | 0.0 /100 | #330 | Tragic 52.9% |
| Hopi | 0.0 /100 | #331 | Tragic 52.9% |
| Natives/Alaskans | 0.0 /100 | #332 | Tragic 53.1% |
| Apache | 0.0 /100 | #333 | Tragic 53.6% |
| Alaskan Athabascans | 0.0 /100 | #334 | Tragic 54.0% |
| Kiowa | 0.0 /100 | #335 | Tragic 54.2% |
| Immigrants | Armenia | 0.0 /100 | #336 | Tragic 54.3% |
| Yuman | 0.0 /100 | #337 | Tragic 54.4% |
| Colville | 0.0 /100 | #338 | Tragic 55.4% |
| Pima | 0.0 /100 | #339 | Tragic 55.8% |
| Pueblo | 0.0 /100 | #340 | Tragic 55.9% |
| Houma | 0.0 /100 | #341 | Tragic 56.2% |