Immigrants from South Africa vs Filipino Disability Age Over 75
COMPARE
Immigrants from South Africa
Filipino
Disability Age Over 75
Disability Age Over 75 Comparison
Immigrants from South Africa
Filipinos
45.3%
DISABILITY AGE OVER 75
100.0/ 100
METRIC RATING
22nd/ 347
METRIC RANK
45.4%
DISABILITY AGE OVER 75
99.9/ 100
METRIC RATING
29th/ 347
METRIC RANK
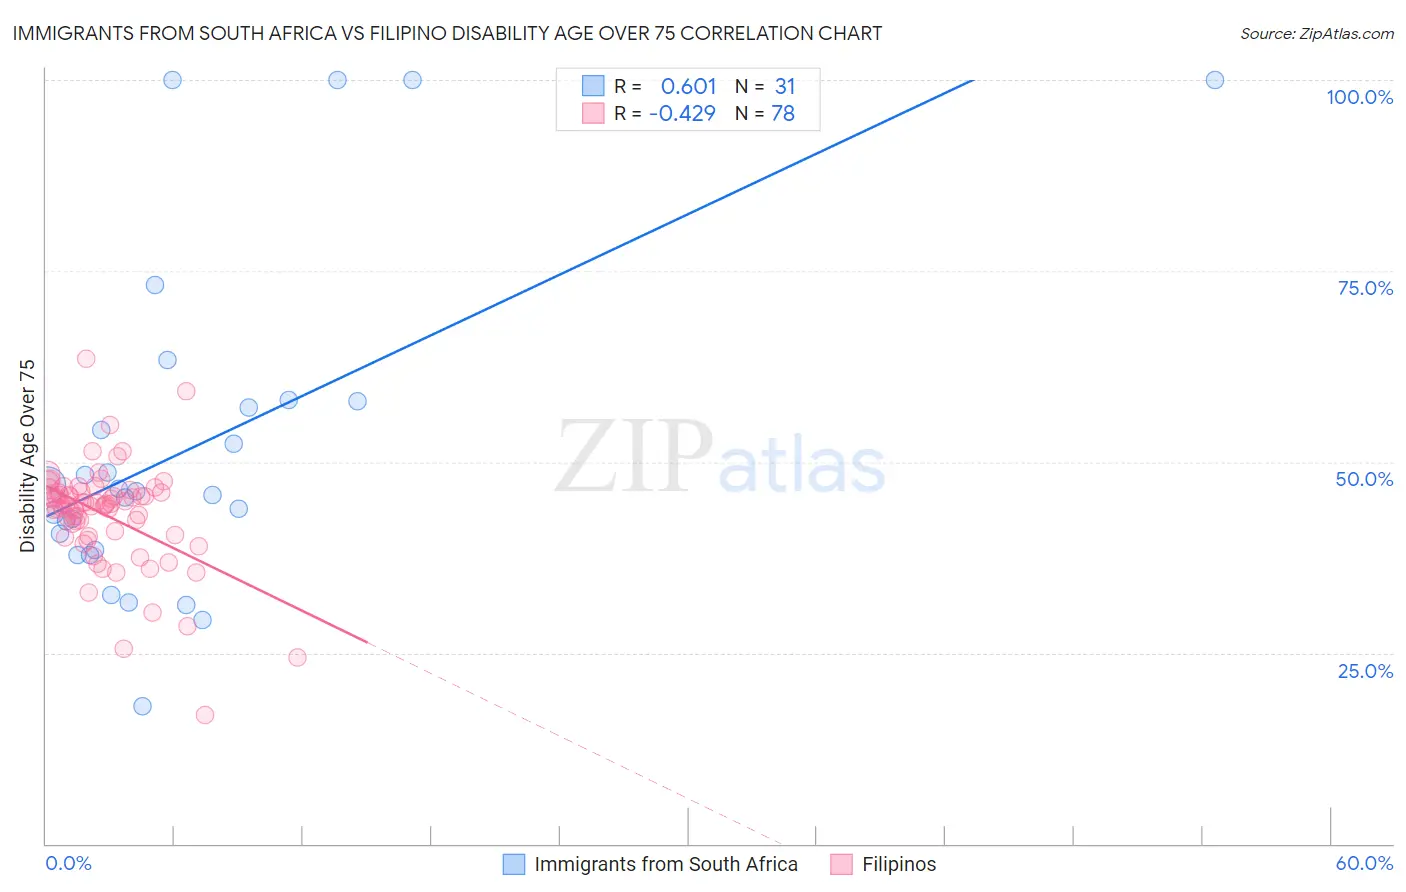
Immigrants from South Africa vs Filipino Disability Age Over 75 Correlation Chart
The statistical analysis conducted on geographies consisting of 233,155,609 people shows a significant positive correlation between the proportion of Immigrants from South Africa and percentage of population with a disability over the age of 75 in the United States with a correlation coefficient (R) of 0.601 and weighted average of 45.3%. Similarly, the statistical analysis conducted on geographies consisting of 253,957,149 people shows a moderate negative correlation between the proportion of Filipinos and percentage of population with a disability over the age of 75 in the United States with a correlation coefficient (R) of -0.429 and weighted average of 45.4%, a difference of 0.21%.
Disability Age Over 75 Correlation Summary
| Measurement | Immigrants from South Africa | Filipino |
| Minimum | 18.0% | 16.9% |
| Maximum | 100.0% | 63.6% |
| Range | 82.0% | 46.6% |
| Mean | 52.0% | 43.1% |
| Median | 46.2% | 44.4% |
| Interquartile 25% (IQ1) | 38.5% | 40.4% |
| Interquartile 75% (IQ3) | 57.9% | 45.9% |
| Interquartile Range (IQR) | 19.4% | 5.5% |
| Standard Deviation (Sample) | 21.6% | 6.8% |
| Standard Deviation (Population) | 21.3% | 6.8% |
Demographics Similar to Immigrants from South Africa and Filipinos by Disability Age Over 75
In terms of disability age over 75, the demographic groups most similar to Immigrants from South Africa are Immigrants from Belgium (45.3%, a difference of 0.030%), Immigrants from Switzerland (45.3%, a difference of 0.030%), Polish (45.3%, a difference of 0.050%), Immigrants from Bolivia (45.4%, a difference of 0.10%), and Macedonian (45.4%, a difference of 0.13%). Similarly, the demographic groups most similar to Filipinos are Immigrants from Denmark (45.4%, a difference of 0.030%), Thai (45.4%, a difference of 0.040%), Immigrants from Poland (45.4%, a difference of 0.060%), Macedonian (45.4%, a difference of 0.080%), and Immigrants from Bulgaria (45.5%, a difference of 0.090%).
| Demographics | Rating | Rank | Disability Age Over 75 |
| Immigrants | Sweden | 100.0 /100 | #15 | Exceptional 45.1% |
| Immigrants | Northern Europe | 100.0 /100 | #16 | Exceptional 45.2% |
| Immigrants | India | 100.0 /100 | #17 | Exceptional 45.2% |
| Bolivians | 100.0 /100 | #18 | Exceptional 45.2% |
| Immigrants | Greece | 100.0 /100 | #19 | Exceptional 45.2% |
| Immigrants | Serbia | 100.0 /100 | #20 | Exceptional 45.3% |
| Immigrants | Belgium | 100.0 /100 | #21 | Exceptional 45.3% |
| Immigrants | South Africa | 100.0 /100 | #22 | Exceptional 45.3% |
| Immigrants | Switzerland | 99.9 /100 | #23 | Exceptional 45.3% |
| Poles | 99.9 /100 | #24 | Exceptional 45.3% |
| Immigrants | Bolivia | 99.9 /100 | #25 | Exceptional 45.4% |
| Macedonians | 99.9 /100 | #26 | Exceptional 45.4% |
| Immigrants | Poland | 99.9 /100 | #27 | Exceptional 45.4% |
| Thais | 99.9 /100 | #28 | Exceptional 45.4% |
| Filipinos | 99.9 /100 | #29 | Exceptional 45.4% |
| Immigrants | Denmark | 99.9 /100 | #30 | Exceptional 45.4% |
| Immigrants | Bulgaria | 99.9 /100 | #31 | Exceptional 45.5% |
| Immigrants | Australia | 99.9 /100 | #32 | Exceptional 45.5% |
| Immigrants | Croatia | 99.9 /100 | #33 | Exceptional 45.5% |
| Russians | 99.9 /100 | #34 | Exceptional 45.5% |
| Norwegians | 99.9 /100 | #35 | Exceptional 45.5% |