Immigrants from South Africa vs Black/African American Female Disability
COMPARE
Immigrants from South Africa
Black/African American
Female Disability
Female Disability Comparison
Immigrants from South Africa
Blacks/African Americans
11.5%
FEMALE DISABILITY
99.7/ 100
METRIC RATING
78th/ 347
METRIC RANK
14.1%
FEMALE DISABILITY
0.0/ 100
METRIC RATING
323rd/ 347
METRIC RANK
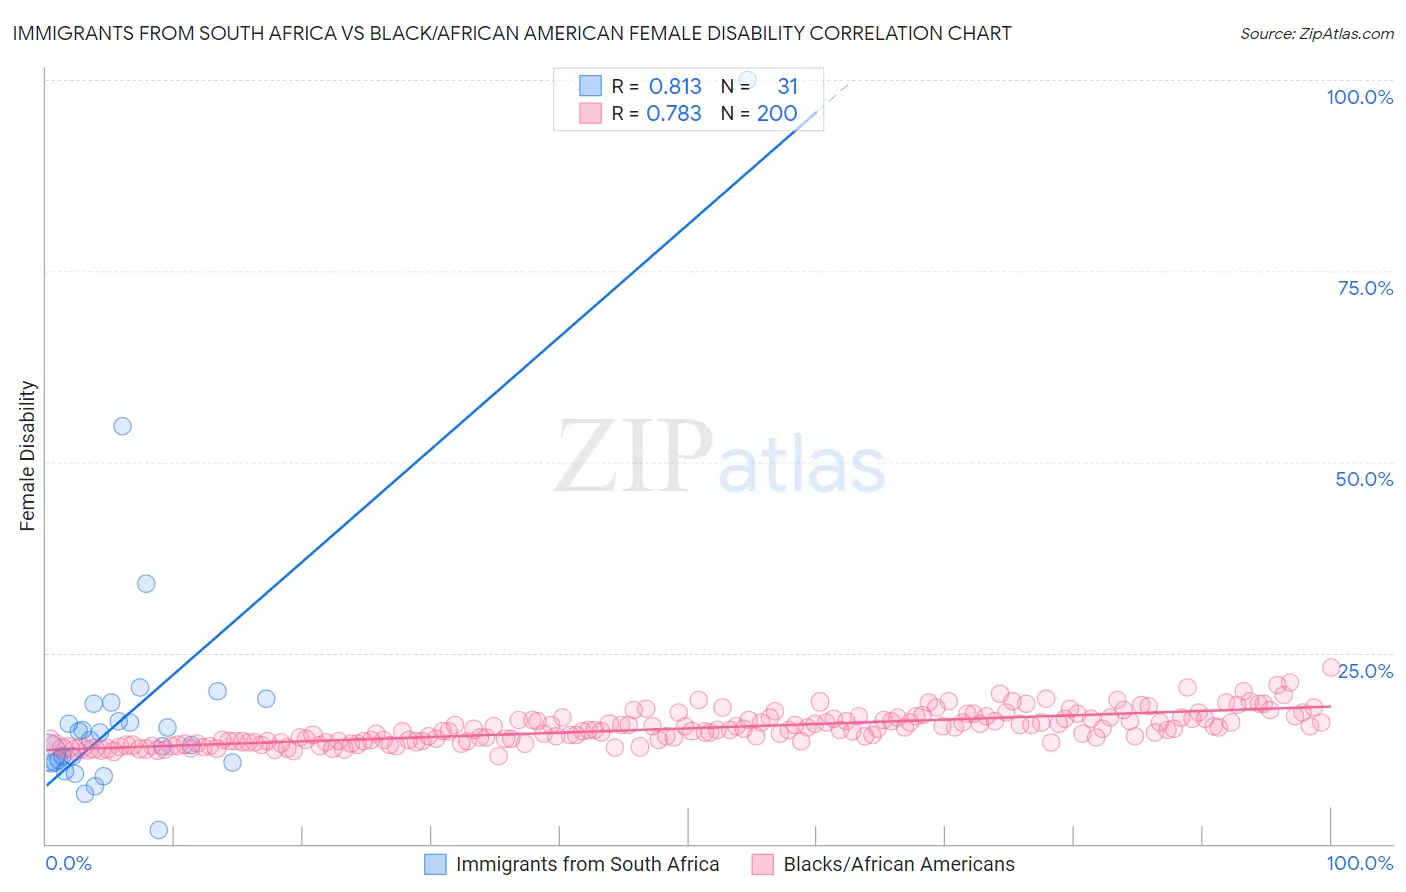
Immigrants from South Africa vs Black/African American Female Disability Correlation Chart
The statistical analysis conducted on geographies consisting of 233,307,950 people shows a very strong positive correlation between the proportion of Immigrants from South Africa and percentage of females with a disability in the United States with a correlation coefficient (R) of 0.813 and weighted average of 11.5%. Similarly, the statistical analysis conducted on geographies consisting of 565,768,097 people shows a strong positive correlation between the proportion of Blacks/African Americans and percentage of females with a disability in the United States with a correlation coefficient (R) of 0.783 and weighted average of 14.1%, a difference of 22.8%.
Female Disability Correlation Summary
| Measurement | Immigrants from South Africa | Black/African American |
| Minimum | 1.8% | 11.4% |
| Maximum | 100.0% | 23.1% |
| Range | 98.2% | 11.6% |
| Mean | 17.8% | 15.1% |
| Median | 13.6% | 14.9% |
| Interquartile 25% (IQ1) | 10.6% | 13.4% |
| Interquartile 75% (IQ3) | 18.3% | 16.4% |
| Interquartile Range (IQR) | 7.7% | 3.0% |
| Standard Deviation (Sample) | 17.8% | 2.1% |
| Standard Deviation (Population) | 17.5% | 2.1% |
Similar Demographics by Female Disability
Demographics Similar to Immigrants from South Africa by Female Disability
In terms of female disability, the demographic groups most similar to Immigrants from South Africa are Immigrants from Eritrea (11.5%, a difference of 0.010%), Immigrants from Afghanistan (11.5%, a difference of 0.010%), Sierra Leonean (11.5%, a difference of 0.020%), Immigrants from Jordan (11.5%, a difference of 0.030%), and Immigrants from Lebanon (11.5%, a difference of 0.040%).
| Demographics | Rating | Rank | Female Disability |
| Immigrants | Ireland | 99.8 /100 | #71 | Exceptional 11.5% |
| Chileans | 99.8 /100 | #72 | Exceptional 11.5% |
| Immigrants | Switzerland | 99.8 /100 | #73 | Exceptional 11.5% |
| Bhutanese | 99.8 /100 | #74 | Exceptional 11.5% |
| Immigrants | Lebanon | 99.7 /100 | #75 | Exceptional 11.5% |
| Immigrants | Eritrea | 99.7 /100 | #76 | Exceptional 11.5% |
| Immigrants | Afghanistan | 99.7 /100 | #77 | Exceptional 11.5% |
| Immigrants | South Africa | 99.7 /100 | #78 | Exceptional 11.5% |
| Sierra Leoneans | 99.7 /100 | #79 | Exceptional 11.5% |
| Immigrants | Jordan | 99.7 /100 | #80 | Exceptional 11.5% |
| Eastern Europeans | 99.7 /100 | #81 | Exceptional 11.5% |
| Luxembourgers | 99.6 /100 | #82 | Exceptional 11.6% |
| Immigrants | Serbia | 99.6 /100 | #83 | Exceptional 11.6% |
| Immigrants | Poland | 99.6 /100 | #84 | Exceptional 11.6% |
| Palestinians | 99.6 /100 | #85 | Exceptional 11.6% |
Demographics Similar to Blacks/African Americans by Female Disability
In terms of female disability, the demographic groups most similar to Blacks/African Americans are Native/Alaskan (14.1%, a difference of 0.020%), Navajo (14.2%, a difference of 0.16%), Pueblo (14.1%, a difference of 0.17%), Potawatomi (14.1%, a difference of 0.18%), and Comanche (14.2%, a difference of 0.27%).
| Demographics | Rating | Rank | Female Disability |
| Spanish Americans | 0.0 /100 | #316 | Tragic 14.0% |
| Chippewa | 0.0 /100 | #317 | Tragic 14.0% |
| Paiute | 0.0 /100 | #318 | Tragic 14.0% |
| Iroquois | 0.0 /100 | #319 | Tragic 14.0% |
| Americans | 0.0 /100 | #320 | Tragic 14.1% |
| Potawatomi | 0.0 /100 | #321 | Tragic 14.1% |
| Pueblo | 0.0 /100 | #322 | Tragic 14.1% |
| Blacks/African Americans | 0.0 /100 | #323 | Tragic 14.1% |
| Natives/Alaskans | 0.0 /100 | #324 | Tragic 14.1% |
| Navajo | 0.0 /100 | #325 | Tragic 14.2% |
| Comanche | 0.0 /100 | #326 | Tragic 14.2% |
| Ottawa | 0.0 /100 | #327 | Tragic 14.2% |
| Cape Verdeans | 0.0 /100 | #328 | Tragic 14.2% |
| Osage | 0.0 /100 | #329 | Tragic 14.3% |
| Yuman | 0.0 /100 | #330 | Tragic 14.5% |