Immigrants from Singapore vs South African Cognitive Disability
COMPARE
Immigrants from Singapore
South African
Cognitive Disability
Cognitive Disability Comparison
Immigrants from Singapore
South Africans
17.5%
COGNITIVE DISABILITY
14.3/ 100
METRIC RATING
199th/ 347
METRIC RANK
16.9%
COGNITIVE DISABILITY
95.5/ 100
METRIC RATING
119th/ 347
METRIC RANK
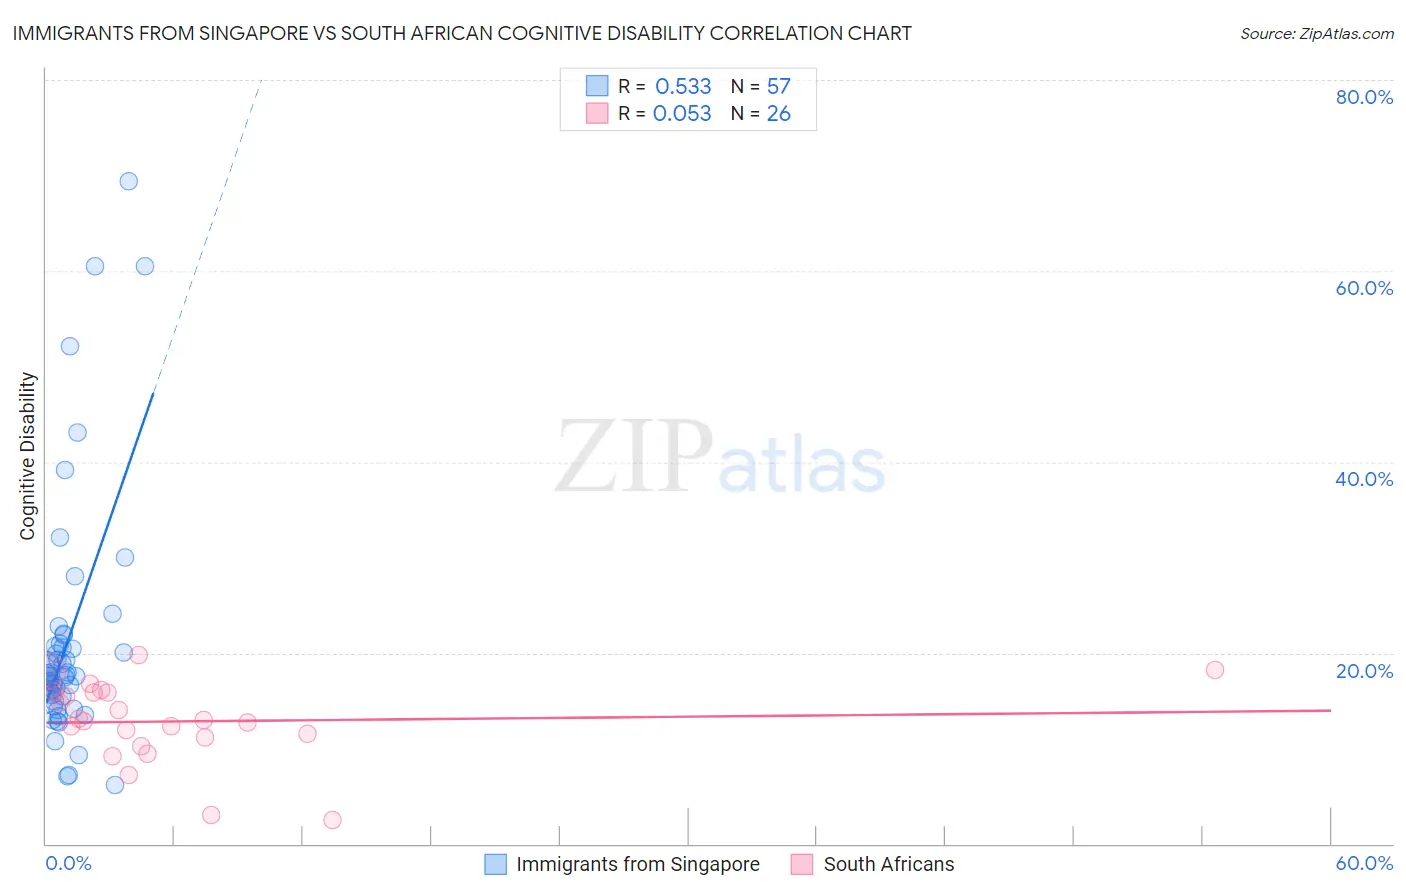
Immigrants from Singapore vs South African Cognitive Disability Correlation Chart
The statistical analysis conducted on geographies consisting of 137,519,920 people shows a substantial positive correlation between the proportion of Immigrants from Singapore and percentage of population with cognitive disability in the United States with a correlation coefficient (R) of 0.533 and weighted average of 17.5%. Similarly, the statistical analysis conducted on geographies consisting of 182,593,753 people shows a slight positive correlation between the proportion of South Africans and percentage of population with cognitive disability in the United States with a correlation coefficient (R) of 0.053 and weighted average of 16.9%, a difference of 3.5%.
Cognitive Disability Correlation Summary
| Measurement | Immigrants from Singapore | South African |
| Minimum | 6.1% | 2.5% |
| Maximum | 69.3% | 19.8% |
| Range | 63.2% | 17.3% |
| Mean | 21.2% | 12.8% |
| Median | 17.6% | 12.9% |
| Interquartile 25% (IQ1) | 15.2% | 11.2% |
| Interquartile 75% (IQ3) | 20.8% | 15.8% |
| Interquartile Range (IQR) | 5.6% | 4.7% |
| Standard Deviation (Sample) | 12.8% | 4.2% |
| Standard Deviation (Population) | 12.7% | 4.1% |
Similar Demographics by Cognitive Disability
Demographics Similar to Immigrants from Singapore by Cognitive Disability
In terms of cognitive disability, the demographic groups most similar to Immigrants from Singapore are Haitian (17.5%, a difference of 0.010%), Immigrants from Panama (17.5%, a difference of 0.030%), South American Indian (17.5%, a difference of 0.080%), Immigrants from Afghanistan (17.5%, a difference of 0.13%), and Immigrants from Morocco (17.5%, a difference of 0.14%).
| Demographics | Rating | Rank | Cognitive Disability |
| Immigrants | Haiti | 27.1 /100 | #192 | Fair 17.4% |
| Delaware | 25.6 /100 | #193 | Fair 17.4% |
| Immigrants | Bosnia and Herzegovina | 22.0 /100 | #194 | Fair 17.4% |
| New Zealanders | 21.1 /100 | #195 | Fair 17.4% |
| Guyanese | 17.5 /100 | #196 | Poor 17.5% |
| Immigrants | Afghanistan | 16.7 /100 | #197 | Poor 17.5% |
| Immigrants | Panama | 14.8 /100 | #198 | Poor 17.5% |
| Immigrants | Singapore | 14.3 /100 | #199 | Poor 17.5% |
| Haitians | 14.1 /100 | #200 | Poor 17.5% |
| South American Indians | 13.0 /100 | #201 | Poor 17.5% |
| Immigrants | Morocco | 12.0 /100 | #202 | Poor 17.5% |
| Immigrants | Caribbean | 11.0 /100 | #203 | Poor 17.5% |
| Immigrants | Zimbabwe | 11.0 /100 | #204 | Poor 17.5% |
| Puget Sound Salish | 10.9 /100 | #205 | Poor 17.5% |
| Alaska Natives | 10.4 /100 | #206 | Poor 17.5% |
Demographics Similar to South Africans by Cognitive Disability
In terms of cognitive disability, the demographic groups most similar to South Africans are Scottish (16.9%, a difference of 0.080%), Immigrants from China (16.9%, a difference of 0.10%), Immigrants from Western Europe (16.9%, a difference of 0.12%), Immigrants from Japan (16.9%, a difference of 0.13%), and Immigrants from Denmark (16.9%, a difference of 0.13%).
| Demographics | Rating | Rank | Cognitive Disability |
| Indians (Asian) | 97.2 /100 | #112 | Exceptional 16.8% |
| Immigrants | Sri Lanka | 97.1 /100 | #113 | Exceptional 16.8% |
| Koreans | 97.1 /100 | #114 | Exceptional 16.8% |
| Yup'ik | 96.9 /100 | #115 | Exceptional 16.9% |
| Inupiat | 96.5 /100 | #116 | Exceptional 16.9% |
| Immigrants | Japan | 96.2 /100 | #117 | Exceptional 16.9% |
| Immigrants | Denmark | 96.2 /100 | #118 | Exceptional 16.9% |
| South Africans | 95.5 /100 | #119 | Exceptional 16.9% |
| Scottish | 95.0 /100 | #120 | Exceptional 16.9% |
| Immigrants | China | 94.9 /100 | #121 | Exceptional 16.9% |
| Immigrants | Western Europe | 94.8 /100 | #122 | Exceptional 16.9% |
| Portuguese | 94.7 /100 | #123 | Exceptional 16.9% |
| Turks | 94.5 /100 | #124 | Exceptional 16.9% |
| Scandinavians | 94.1 /100 | #125 | Exceptional 16.9% |
| Europeans | 93.4 /100 | #126 | Exceptional 17.0% |