Immigrants from Japan vs South African Cognitive Disability
COMPARE
Immigrants from Japan
South African
Cognitive Disability
Cognitive Disability Comparison
Immigrants from Japan
South Africans
16.9%
COGNITIVE DISABILITY
96.2/ 100
METRIC RATING
117th/ 347
METRIC RANK
16.9%
COGNITIVE DISABILITY
95.5/ 100
METRIC RATING
119th/ 347
METRIC RANK
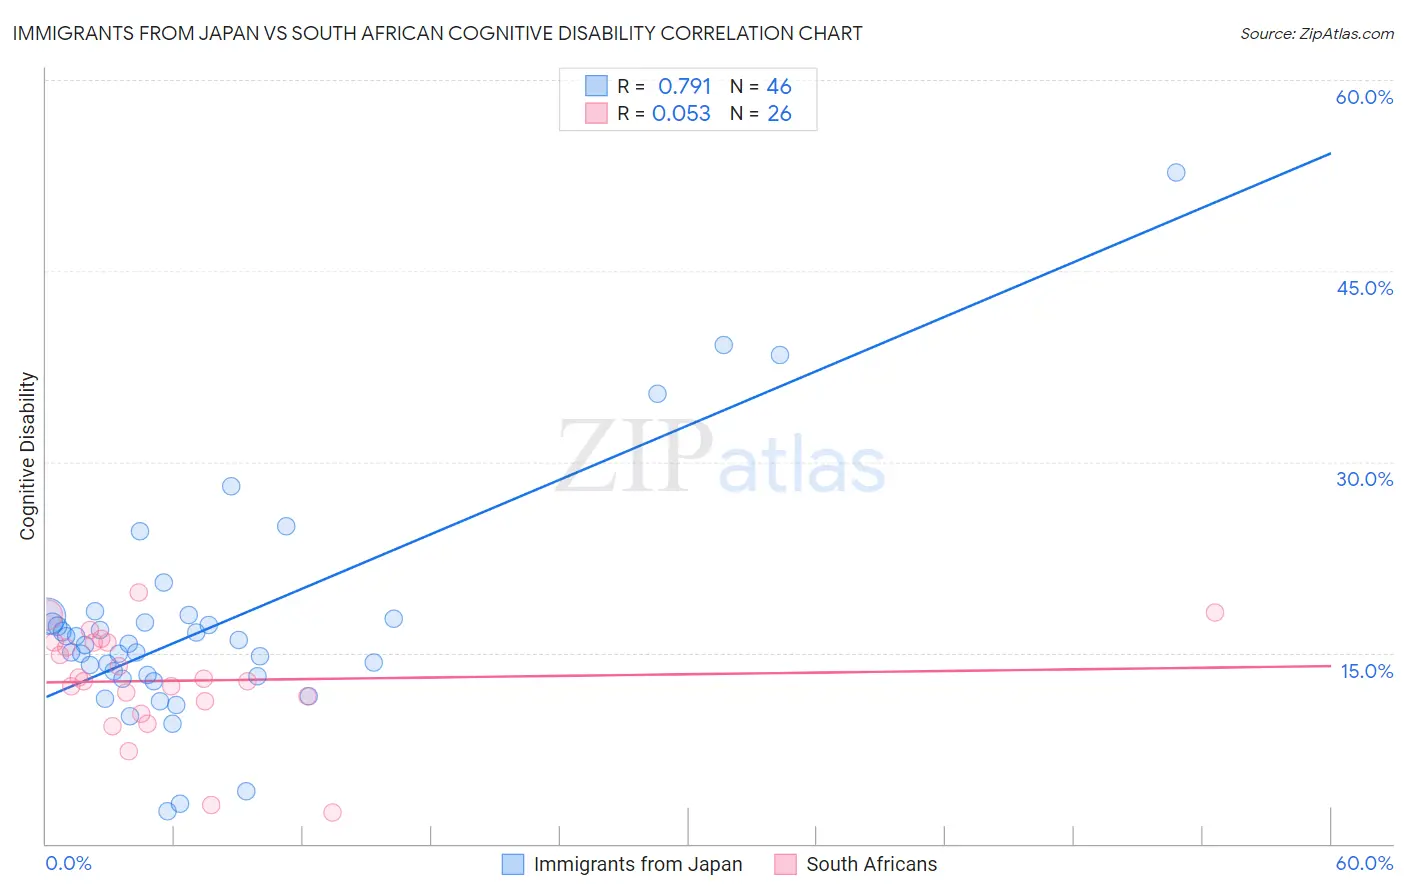
Immigrants from Japan vs South African Cognitive Disability Correlation Chart
The statistical analysis conducted on geographies consisting of 340,148,832 people shows a strong positive correlation between the proportion of Immigrants from Japan and percentage of population with cognitive disability in the United States with a correlation coefficient (R) of 0.791 and weighted average of 16.9%. Similarly, the statistical analysis conducted on geographies consisting of 182,593,753 people shows a slight positive correlation between the proportion of South Africans and percentage of population with cognitive disability in the United States with a correlation coefficient (R) of 0.053 and weighted average of 16.9%, a difference of 0.13%.
Cognitive Disability Correlation Summary
| Measurement | Immigrants from Japan | South African |
| Minimum | 2.6% | 2.5% |
| Maximum | 52.8% | 19.8% |
| Range | 50.2% | 17.3% |
| Mean | 17.2% | 12.8% |
| Median | 15.7% | 12.9% |
| Interquartile 25% (IQ1) | 13.1% | 11.2% |
| Interquartile 75% (IQ3) | 17.7% | 15.8% |
| Interquartile Range (IQR) | 4.6% | 4.7% |
| Standard Deviation (Sample) | 9.1% | 4.2% |
| Standard Deviation (Population) | 9.0% | 4.1% |
Demographics Similar to Immigrants from Japan and South Africans by Cognitive Disability
In terms of cognitive disability, the demographic groups most similar to Immigrants from Japan are Immigrants from Denmark (16.9%, a difference of 0.010%), Inupiat (16.9%, a difference of 0.050%), Yup'ik (16.9%, a difference of 0.15%), Korean (16.8%, a difference of 0.20%), and Indian (Asian) (16.8%, a difference of 0.21%). Similarly, the demographic groups most similar to South Africans are Scottish (16.9%, a difference of 0.080%), Immigrants from China (16.9%, a difference of 0.10%), Immigrants from Western Europe (16.9%, a difference of 0.12%), Immigrants from Denmark (16.9%, a difference of 0.13%), and Portuguese (16.9%, a difference of 0.13%).
| Demographics | Rating | Rank | Cognitive Disability |
| Canadians | 97.5 /100 | #108 | Exceptional 16.8% |
| Albanians | 97.3 /100 | #109 | Exceptional 16.8% |
| Arapaho | 97.3 /100 | #110 | Exceptional 16.8% |
| Uruguayans | 97.2 /100 | #111 | Exceptional 16.8% |
| Indians (Asian) | 97.2 /100 | #112 | Exceptional 16.8% |
| Immigrants | Sri Lanka | 97.1 /100 | #113 | Exceptional 16.8% |
| Koreans | 97.1 /100 | #114 | Exceptional 16.8% |
| Yup'ik | 96.9 /100 | #115 | Exceptional 16.9% |
| Inupiat | 96.5 /100 | #116 | Exceptional 16.9% |
| Immigrants | Japan | 96.2 /100 | #117 | Exceptional 16.9% |
| Immigrants | Denmark | 96.2 /100 | #118 | Exceptional 16.9% |
| South Africans | 95.5 /100 | #119 | Exceptional 16.9% |
| Scottish | 95.0 /100 | #120 | Exceptional 16.9% |
| Immigrants | China | 94.9 /100 | #121 | Exceptional 16.9% |
| Immigrants | Western Europe | 94.8 /100 | #122 | Exceptional 16.9% |
| Portuguese | 94.7 /100 | #123 | Exceptional 16.9% |
| Turks | 94.5 /100 | #124 | Exceptional 16.9% |
| Scandinavians | 94.1 /100 | #125 | Exceptional 16.9% |
| Europeans | 93.4 /100 | #126 | Exceptional 17.0% |
| Immigrants | Costa Rica | 93.1 /100 | #127 | Exceptional 17.0% |
| Nicaraguans | 93.0 /100 | #128 | Exceptional 17.0% |