Immigrants from Singapore vs South African Householder Income Ages 45 - 64 years

COMPARE

Immigrants from Singapore
Race
Ancestry
AfghanAfricanAlaska NativeAlaskan AthabascanAlbanianAleutAlsatianAmericanApacheArabArapahoArgentineanArmenianAssyrian/Chaldean/SyriacAustralianAustrianBahamianBangladeshiBarbadianBasqueBelgianBelizeanBermudanBhutaneseBlackfeetBolivianBrazilianBritishBritish West IndianBulgarianBurmeseCajunCambodianCanadianCape VerdeanCarpatho RusynCelticCentral AmericanCentral American IndianCherokeeCheyenneChickasawChileanChineseChippewaChoctawColombianColvilleComancheCosta RicanCreeCreekCroatianCrowCubanCypriotCzechCzechoslovakianDanishDelawareDominicanDutchDutch West IndianEastern EuropeanEcuadorianEgyptianEnglishEstonianEthiopianEuropeanFijianFilipinoFinnishFrenchFrench American IndianFrench CanadianGermanGerman RussianGhanaianGreekGuamanian/ChamorroGuatemalanGuyaneseHaitianHmongHonduranHopiHoumaHungarianIcelanderIndian (Asian)IndonesianInupiatIranianIraqiIrishIroquoisIsraeliItalianJamaicanJapaneseJordanianKenyanKiowaKoreanLaotianLatvianLebaneseLiberianLithuanianLumbeeLuxembourgerMacedonianMalaysianMalteseMarshalleseMenomineeMexicanMexican American IndianMongolianMoroccanNative HawaiianNavajoNepaleseNew ZealanderNicaraguanNigerianNorthern EuropeanNorwegianOkinawanOsageOttawaPaiutePakistaniPalestinianPanamanianParaguayanPennsylvania GermanPeruvianPimaPolishPortuguesePotawatomiPuebloPuerto RicanPuget Sound SalishRomanianRussianSalvadoranSamoanScandinavianScotch-IrishScottishSeminoleSenegaleseSerbianShoshoneSierra LeoneanSiouxSlavicSlovakSloveneSomaliSouth AmericanSouth American IndianSoviet UnionSpaniardSpanishSpanish AmericanSpanish American IndianSri LankanSubsaharan AfricanSudaneseSwedishSwissSyrianTaiwaneseThaiTlingit-HaidaTohono O'OdhamTonganTrinidadian and TobagonianTsimshianTurkishU.S. Virgin IslanderUgandanUkrainianUruguayanUteVenezuelanVietnameseWelshWest IndianYakamaYaquiYugoslavianYumanYup'ikZimbabwean
Immigration
NonimmigrantsImmigrantsAfghanistanAfricaAlbaniaArgentinaArmeniaAsiaAustraliaAustriaBahamasBangladeshBarbadosBelarusBelgiumBelizeBoliviaBosnia and HerzegovinaBrazilBulgariaBurma/MyanmarCabo VerdeCambodiaCameroonCanadaCaribbeanCentral AmericaChileChinaColombiaCongoCosta RicaCroatiaCubaCzechoslovakiaDenmarkDominicaDominican RepublicEastern AfricaEastern AsiaEastern EuropeEcuadorEgyptEl SalvadorEnglandEritreaEthiopiaEuropeFijiFranceGermanyGhanaGreeceGrenadaGuatemalaGuyanaHaitiHondurasHong KongHungaryIndiaIndonesiaIranIraqIrelandIsraelItalyJamaicaJapanJordanKazakhstanKenyaKoreaKuwaitLaosLatin AmericaLatviaLebanonLiberiaLithuaniaMalaysiaMexicoMicronesiaMiddle AfricaMoldovaMoroccoNepalNetherlandsNicaraguaNigeriaNorth AmericaNorth MacedoniaNorthern AfricaNorthern EuropeNorwayOceaniaPakistanPanamaPeruPhilippinesPolandPortugalRomaniaRussiaSaudi ArabiaScotlandSenegalSerbiaSierra LeoneSingaporeSomaliaSouth AfricaSouth AmericaSouth Central AsiaSouth Eastern AsiaSouthern EuropeSpainSri LankaSt. Vincent and the GrenadinesSudanSwedenSwitzerlandSyriaTaiwanThailandTrinidad and TobagoTurkeyUgandaUkraineUruguayUzbekistanVenezuelaVietnamWest IndiesWestern AfricaWestern AsiaWestern EuropeYemenZaireZimbabweAzores
South African
Race
Ancestry
AfghanAfricanAlaska NativeAlaskan AthabascanAlbanianAleutAlsatianAmericanApacheArabArapahoArgentineanArmenianAssyrian/Chaldean/SyriacAustralianAustrianBahamianBangladeshiBarbadianBasqueBelgianBelizeanBermudanBhutaneseBlackfeetBolivianBrazilianBritishBritish West IndianBulgarianBurmeseCajunCambodianCanadianCape VerdeanCarpatho RusynCelticCentral AmericanCentral American IndianCherokeeCheyenneChickasawChileanChineseChippewaChoctawColombianColvilleComancheCosta RicanCreeCreekCroatianCrowCubanCypriotCzechCzechoslovakianDanishDelawareDominicanDutchDutch West IndianEastern EuropeanEcuadorianEgyptianEnglishEstonianEthiopianEuropeanFijianFilipinoFinnishFrenchFrench American IndianFrench CanadianGermanGerman RussianGhanaianGreekGuamanian/ChamorroGuatemalanGuyaneseHaitianHmongHonduranHopiHoumaHungarianIcelanderIndian (Asian)IndonesianInupiatIranianIraqiIrishIroquoisIsraeliItalianJamaicanJapaneseJordanianKenyanKiowaKoreanLaotianLatvianLebaneseLiberianLithuanianLumbeeLuxembourgerMacedonianMalaysianMalteseMarshalleseMenomineeMexicanMexican American IndianMongolianMoroccanNative HawaiianNavajoNepaleseNew ZealanderNicaraguanNigerianNorthern EuropeanNorwegianOkinawanOsageOttawaPaiutePakistaniPalestinianPanamanianParaguayanPennsylvania GermanPeruvianPimaPolishPortuguesePotawatomiPuebloPuerto RicanPuget Sound SalishRomanianRussianSalvadoranSamoanScandinavianScotch-IrishScottishSeminoleSenegaleseSerbianShoshoneSierra LeoneanSiouxSlavicSlovakSloveneSomaliSouth AfricanSouth AmericanSouth American IndianSoviet UnionSpaniardSpanishSpanish AmericanSpanish American IndianSri LankanSubsaharan AfricanSudaneseSwedishSwissSyrianTaiwaneseThaiTlingit-HaidaTohono O'OdhamTonganTrinidadian and TobagonianTsimshianTurkishU.S. Virgin IslanderUgandanUkrainianUruguayanUteVenezuelanVietnameseWelshWest IndianYakamaYaquiYugoslavianYumanYup'ikZimbabwean
Immigration
NonimmigrantsImmigrantsAfghanistanAfricaAlbaniaArgentinaArmeniaAsiaAustraliaAustriaBahamasBangladeshBarbadosBelarusBelgiumBelizeBoliviaBosnia and HerzegovinaBrazilBulgariaBurma/MyanmarCabo VerdeCambodiaCameroonCanadaCaribbeanCentral AmericaChileChinaColombiaCongoCosta RicaCroatiaCubaCzechoslovakiaDenmarkDominicaDominican RepublicEastern AfricaEastern AsiaEastern EuropeEcuadorEgyptEl SalvadorEnglandEritreaEthiopiaEuropeFijiFranceGermanyGhanaGreeceGrenadaGuatemalaGuyanaHaitiHondurasHong KongHungaryIndiaIndonesiaIranIraqIrelandIsraelItalyJamaicaJapanJordanKazakhstanKenyaKoreaKuwaitLaosLatin AmericaLatviaLebanonLiberiaLithuaniaMalaysiaMexicoMicronesiaMiddle AfricaMoldovaMoroccoNepalNetherlandsNicaraguaNigeriaNorth AmericaNorth MacedoniaNorthern AfricaNorthern EuropeNorwayOceaniaPakistanPanamaPeruPhilippinesPolandPortugalRomaniaRussiaSaudi ArabiaScotlandSenegalSerbiaSierra LeoneSomaliaSouth AfricaSouth AmericaSouth Central AsiaSouth Eastern AsiaSouthern EuropeSpainSri LankaSt. Vincent and the GrenadinesSudanSwedenSwitzerlandSyriaTaiwanThailandTrinidad and TobagoTurkeyUgandaUkraineUruguayUzbekistanVenezuelaVietnamWest IndiesWestern AfricaWestern AsiaWestern EuropeYemenZaireZimbabweAzores
Householder Income Ages 45 - 64 years
Income
Poverty
Unemployment
Labor Participation
Family Structure
Vehicle Availability
Education Level
Disability

Householder Income Ages 45 - 64 years Comparison

Immigrants from Singapore

South Africans

Exceptional
Exceptional
$129,514
HOUSEHOLDER INCOME AGES 45 - 64 YEARS
100.0/ 100
METRIC RATING
5th/ 347
METRIC RANK
$109,719
HOUSEHOLDER INCOME AGES 45 - 64 YEARS
99.1/ 100
METRIC RATING
75th/ 347
METRIC RANK

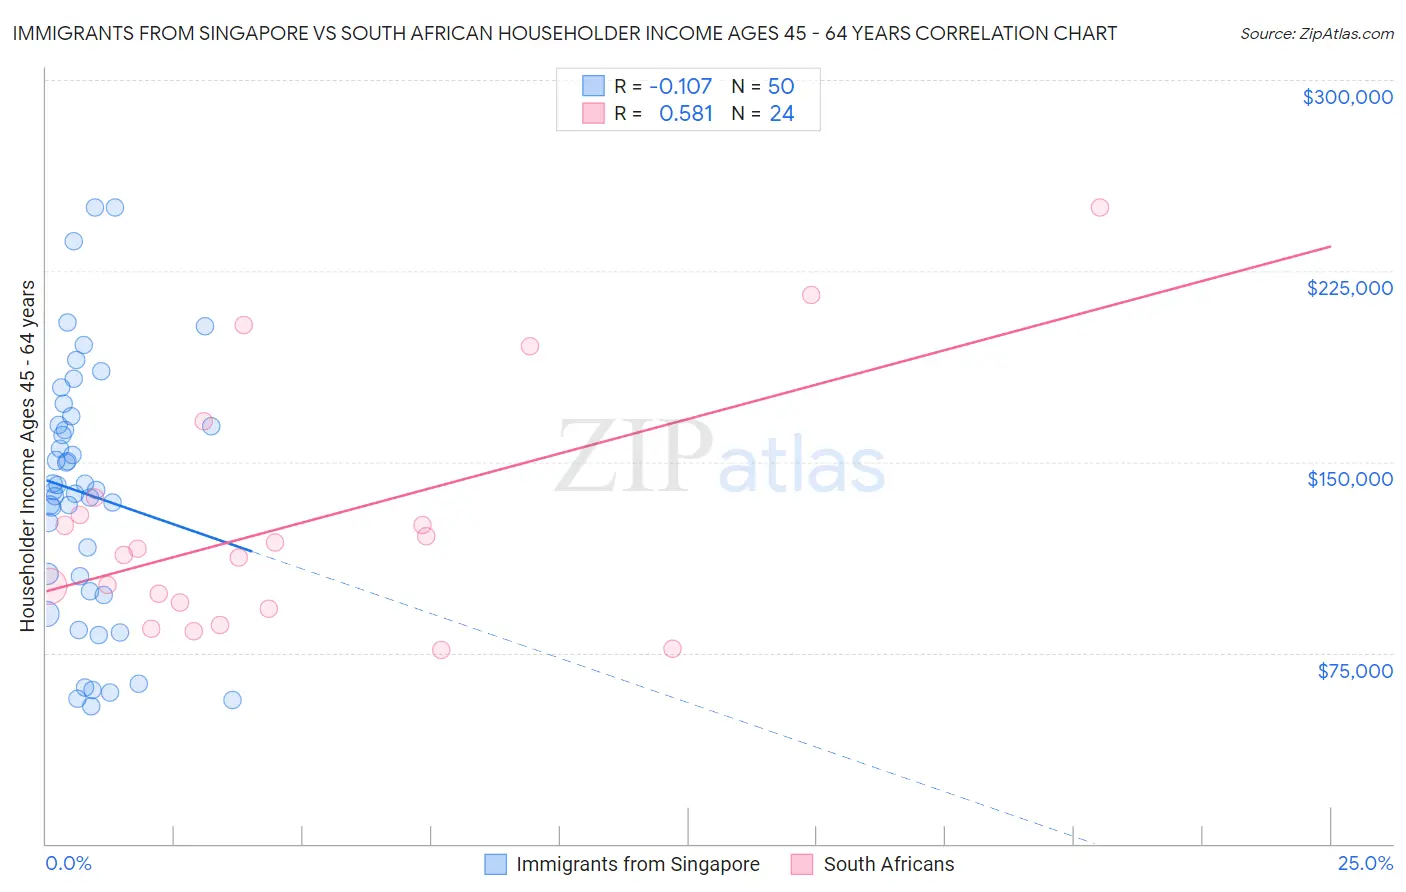
Immigrants from Singapore vs South African Householder Income Ages 45 - 64 years Correlation Chart

The statistical analysis conducted on geographies consisting of 137,361,337 people shows a poor negative correlation between the proportion of Immigrants from Singapore and household income with householder between the ages 45 and 64 in the United States with a correlation coefficient (R) of -0.107 and weighted average of $129,514. Similarly, the statistical analysis conducted on geographies consisting of 182,453,262 people shows a substantial positive correlation between the proportion of South Africans and household income with householder between the ages 45 and 64 in the United States with a correlation coefficient (R) of 0.581 and weighted average of $109,719, a difference of 18.0%.
Immigrants from Singapore vs South African Householder Income Ages 45 - 64 years

Householder Income Ages 45 - 64 years Correlation Summary

MeasurementImmigrants from SingaporeSouth African
Minimum$54,074$76,250
Maximum$250,001$250,001
Range$195,927$173,751
Mean$137,475$125,894
Median$138,678$114,605
Interquartile 25% (IQ1)$99,063$93,424
Interquartile 75% (IQ3)$164,348$132,734
Interquartile Range (IQR)$65,285$39,311
Standard Deviation (Sample)$49,976$46,946
Standard Deviation (Population)$49,474$45,958

Similar Demographics by Householder Income Ages 45 - 64 years

Demographics Similar to Immigrants from Singapore by Householder Income Ages 45 - 64 years

In terms of householder income ages 45 - 64 years, the demographic groups most similar to Immigrants from Singapore are Thai ($129,560, a difference of 0.040%), Iranian ($129,350, a difference of 0.13%), Immigrants from Hong Kong ($127,500, a difference of 1.6%), Immigrants from Iran ($126,940, a difference of 2.0%), and Immigrants from India ($132,488, a difference of 2.3%).
DemographicsRating | RankHouseholder Income Ages 45 - 64 years
Immigrants | Taiwan
100.0
/100
|
#1
Exceptional
$135,508
Filipinos
100.0
/100
|
#2
Exceptional
$134,910
Immigrants | India
100.0
/100
|
#3
Exceptional
$132,488
Thais
100.0
/100
|
#4
Exceptional
$129,560
Immigrants | Singapore
100.0
/100
|
#5
Exceptional
$129,514
Iranians
100.0
/100
|
#6
Exceptional
$129,350
Immigrants | Hong Kong
100.0
/100
|
#7
Exceptional
$127,500
Immigrants | Iran
100.0
/100
|
#8
Exceptional
$126,940
Okinawans
100.0
/100
|
#9
Exceptional
$124,796
Immigrants | South Central Asia
100.0
/100
|
#10
Exceptional
$124,188
Cypriots
100.0
/100
|
#11
Exceptional
$123,396
Immigrants | Israel
100.0
/100
|
#12
Exceptional
$122,893
Immigrants | Ireland
100.0
/100
|
#13
Exceptional
$122,757
Indians (Asian)
100.0
/100
|
#14
Exceptional
$122,343
Immigrants | Eastern Asia
100.0
/100
|
#15
Exceptional
$122,222

Demographics Similar to South Africans by Householder Income Ages 45 - 64 years

In terms of householder income ages 45 - 64 years, the demographic groups most similar to South Africans are Immigrants from Egypt ($109,941, a difference of 0.20%), Paraguayan ($109,447, a difference of 0.25%), Immigrants from England ($109,446, a difference of 0.25%), Immigrants from Canada ($109,402, a difference of 0.29%), and Immigrants from Bulgaria ($109,379, a difference of 0.31%).
DemographicsRating | RankHouseholder Income Ages 45 - 64 years
Immigrants | Romania
99.4
/100
|
#68
Exceptional
$110,633
Immigrants | Italy
99.4
/100
|
#69
Exceptional
$110,434
Koreans
99.3
/100
|
#70
Exceptional
$110,334
Italians
99.3
/100
|
#71
Exceptional
$110,224
Assyrians/Chaldeans/Syriacs
99.3
/100
|
#72
Exceptional
$110,201
Argentineans
99.3
/100
|
#73
Exceptional
$110,103
Immigrants | Egypt
99.2
/100
|
#74
Exceptional
$109,941
South Africans
99.1
/100
|
#75
Exceptional
$109,719
Paraguayans
99.0
/100
|
#76
Exceptional
$109,447
Immigrants | England
99.0
/100
|
#77
Exceptional
$109,446
Immigrants | Canada
99.0
/100
|
#78
Exceptional
$109,402
Immigrants | Bulgaria
98.9
/100
|
#79
Exceptional
$109,379
Jordanians
98.9
/100
|
#80
Exceptional
$109,376
Immigrants | Eastern Europe
98.9
/100
|
#81
Exceptional
$109,335
Immigrants | North America
98.8
/100
|
#82
Exceptional
$109,198