Immigrants from Singapore vs Immigrants from Somalia Cognitive Disability
COMPARE
Immigrants from Singapore
Immigrants from Somalia
Cognitive Disability
Cognitive Disability Comparison
Immigrants from Singapore
Immigrants from Somalia
17.5%
COGNITIVE DISABILITY
14.3/ 100
METRIC RATING
199th/ 347
METRIC RANK
20.0%
COGNITIVE DISABILITY
0.0/ 100
METRIC RATING
347th/ 347
METRIC RANK
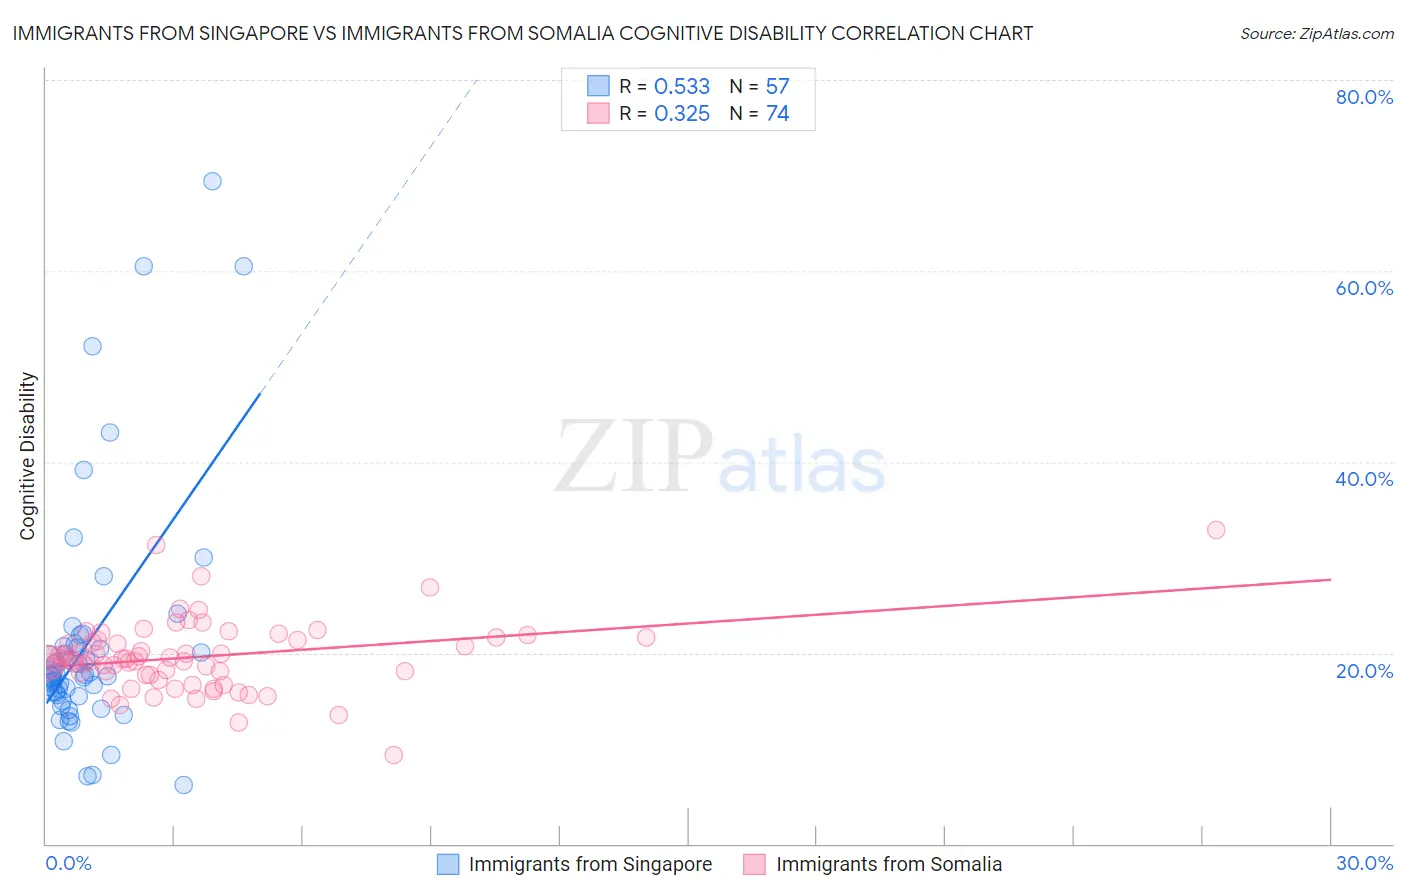
Immigrants from Singapore vs Immigrants from Somalia Cognitive Disability Correlation Chart
The statistical analysis conducted on geographies consisting of 137,519,920 people shows a substantial positive correlation between the proportion of Immigrants from Singapore and percentage of population with cognitive disability in the United States with a correlation coefficient (R) of 0.533 and weighted average of 17.5%. Similarly, the statistical analysis conducted on geographies consisting of 92,095,793 people shows a mild positive correlation between the proportion of Immigrants from Somalia and percentage of population with cognitive disability in the United States with a correlation coefficient (R) of 0.325 and weighted average of 20.0%, a difference of 14.3%.
Cognitive Disability Correlation Summary
| Measurement | Immigrants from Singapore | Immigrants from Somalia |
| Minimum | 6.1% | 9.3% |
| Maximum | 69.3% | 32.8% |
| Range | 63.2% | 23.6% |
| Mean | 21.2% | 19.6% |
| Median | 17.6% | 19.3% |
| Interquartile 25% (IQ1) | 15.2% | 17.7% |
| Interquartile 75% (IQ3) | 20.8% | 21.4% |
| Interquartile Range (IQR) | 5.6% | 3.7% |
| Standard Deviation (Sample) | 12.8% | 3.7% |
| Standard Deviation (Population) | 12.7% | 3.7% |
Similar Demographics by Cognitive Disability
Demographics Similar to Immigrants from Singapore by Cognitive Disability
In terms of cognitive disability, the demographic groups most similar to Immigrants from Singapore are Haitian (17.5%, a difference of 0.010%), Immigrants from Panama (17.5%, a difference of 0.030%), South American Indian (17.5%, a difference of 0.080%), Immigrants from Afghanistan (17.5%, a difference of 0.13%), and Immigrants from Morocco (17.5%, a difference of 0.14%).
| Demographics | Rating | Rank | Cognitive Disability |
| Immigrants | Haiti | 27.1 /100 | #192 | Fair 17.4% |
| Delaware | 25.6 /100 | #193 | Fair 17.4% |
| Immigrants | Bosnia and Herzegovina | 22.0 /100 | #194 | Fair 17.4% |
| New Zealanders | 21.1 /100 | #195 | Fair 17.4% |
| Guyanese | 17.5 /100 | #196 | Poor 17.5% |
| Immigrants | Afghanistan | 16.7 /100 | #197 | Poor 17.5% |
| Immigrants | Panama | 14.8 /100 | #198 | Poor 17.5% |
| Immigrants | Singapore | 14.3 /100 | #199 | Poor 17.5% |
| Haitians | 14.1 /100 | #200 | Poor 17.5% |
| South American Indians | 13.0 /100 | #201 | Poor 17.5% |
| Immigrants | Morocco | 12.0 /100 | #202 | Poor 17.5% |
| Immigrants | Caribbean | 11.0 /100 | #203 | Poor 17.5% |
| Immigrants | Zimbabwe | 11.0 /100 | #204 | Poor 17.5% |
| Puget Sound Salish | 10.9 /100 | #205 | Poor 17.5% |
| Alaska Natives | 10.4 /100 | #206 | Poor 17.5% |
Demographics Similar to Immigrants from Somalia by Cognitive Disability
In terms of cognitive disability, the demographic groups most similar to Immigrants from Somalia are Immigrants from Cabo Verde (19.9%, a difference of 0.73%), Somali (19.8%, a difference of 0.89%), Immigrants from Congo (19.7%, a difference of 1.5%), Immigrants from Zaire (19.4%, a difference of 3.1%), and Tohono O'odham (19.3%, a difference of 3.8%).
| Demographics | Rating | Rank | Cognitive Disability |
| Immigrants | Yemen | 0.0 /100 | #333 | Tragic 18.8% |
| Sudanese | 0.0 /100 | #334 | Tragic 18.9% |
| Senegalese | 0.0 /100 | #335 | Tragic 19.0% |
| Blacks/African Americans | 0.0 /100 | #336 | Tragic 19.0% |
| Immigrants | Saudi Arabia | 0.0 /100 | #337 | Tragic 19.1% |
| Lumbee | 0.0 /100 | #338 | Tragic 19.1% |
| Puerto Ricans | 0.0 /100 | #339 | Tragic 19.2% |
| Cape Verdeans | 0.0 /100 | #340 | Tragic 19.2% |
| Tohono O'odham | 0.0 /100 | #341 | Tragic 19.3% |
| Houma | 0.0 /100 | #342 | Tragic 19.3% |
| Immigrants | Zaire | 0.0 /100 | #343 | Tragic 19.4% |
| Immigrants | Congo | 0.0 /100 | #344 | Tragic 19.7% |
| Somalis | 0.0 /100 | #345 | Tragic 19.8% |
| Immigrants | Cabo Verde | 0.0 /100 | #346 | Tragic 19.9% |
| Immigrants | Somalia | 0.0 /100 | #347 | Tragic 20.0% |