Immigrants from Saudi Arabia vs South African Cognitive Disability
COMPARE
Immigrants from Saudi Arabia
South African
Cognitive Disability
Cognitive Disability Comparison
Immigrants from Saudi Arabia
South Africans
19.1%
COGNITIVE DISABILITY
0.0/ 100
METRIC RATING
337th/ 347
METRIC RANK
16.9%
COGNITIVE DISABILITY
95.5/ 100
METRIC RATING
119th/ 347
METRIC RANK
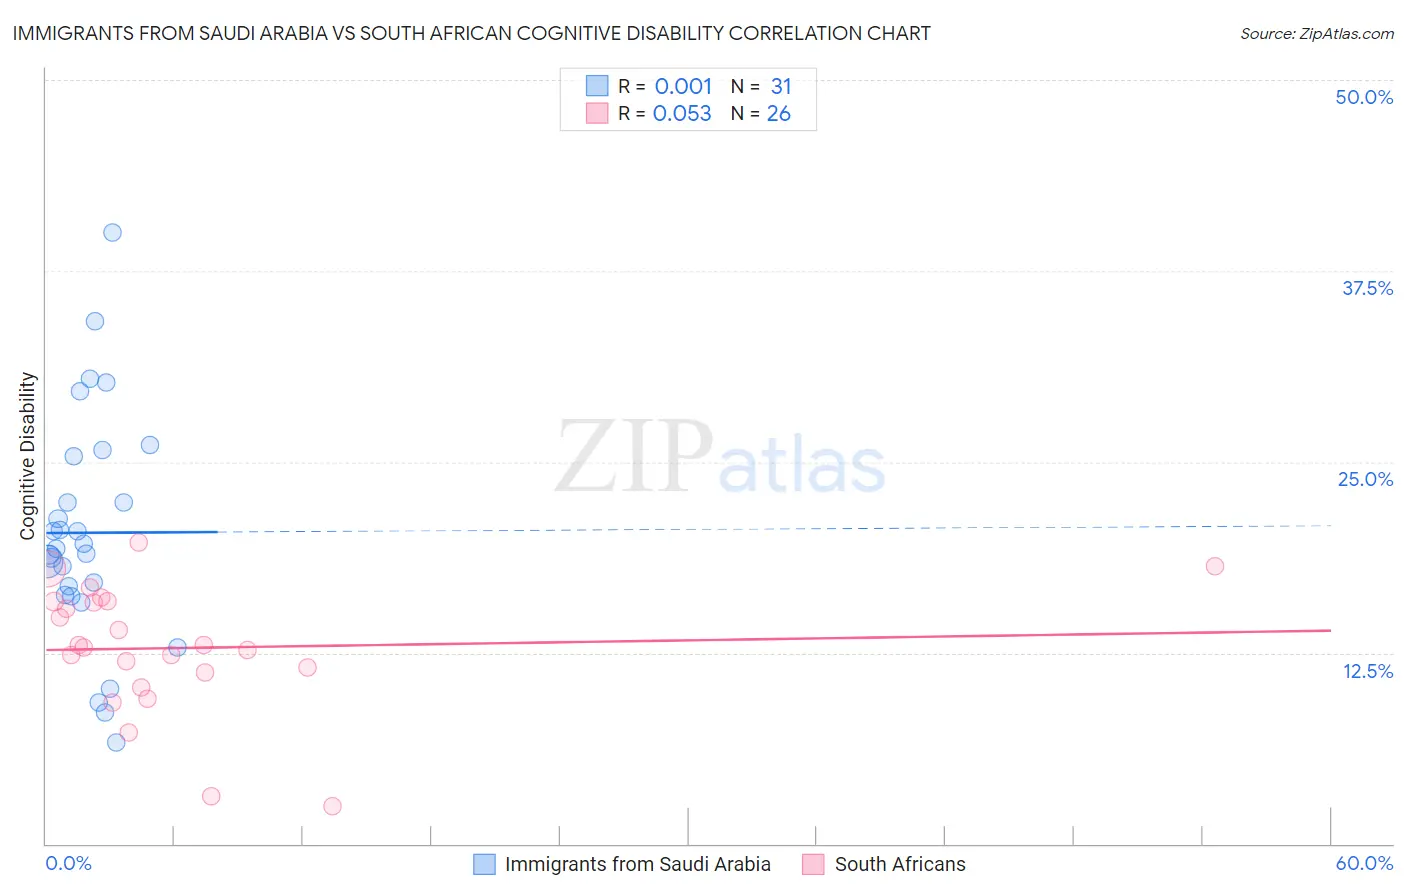
Immigrants from Saudi Arabia vs South African Cognitive Disability Correlation Chart
The statistical analysis conducted on geographies consisting of 164,285,964 people shows no correlation between the proportion of Immigrants from Saudi Arabia and percentage of population with cognitive disability in the United States with a correlation coefficient (R) of 0.001 and weighted average of 19.1%. Similarly, the statistical analysis conducted on geographies consisting of 182,593,753 people shows a slight positive correlation between the proportion of South Africans and percentage of population with cognitive disability in the United States with a correlation coefficient (R) of 0.053 and weighted average of 16.9%, a difference of 12.8%.
Cognitive Disability Correlation Summary
| Measurement | Immigrants from Saudi Arabia | South African |
| Minimum | 6.6% | 2.5% |
| Maximum | 40.0% | 19.8% |
| Range | 33.4% | 17.3% |
| Mean | 20.4% | 12.8% |
| Median | 19.3% | 12.9% |
| Interquartile 25% (IQ1) | 16.3% | 11.2% |
| Interquartile 75% (IQ3) | 25.4% | 15.8% |
| Interquartile Range (IQR) | 9.1% | 4.7% |
| Standard Deviation (Sample) | 7.4% | 4.2% |
| Standard Deviation (Population) | 7.3% | 4.1% |
Similar Demographics by Cognitive Disability
Demographics Similar to Immigrants from Saudi Arabia by Cognitive Disability
In terms of cognitive disability, the demographic groups most similar to Immigrants from Saudi Arabia are Black/African American (19.0%, a difference of 0.13%), Lumbee (19.1%, a difference of 0.34%), Senegalese (19.0%, a difference of 0.42%), Puerto Rican (19.2%, a difference of 0.82%), and Cape Verdean (19.2%, a difference of 0.84%).
| Demographics | Rating | Rank | Cognitive Disability |
| Immigrants | Dominican Republic | 0.0 /100 | #330 | Tragic 18.8% |
| Pima | 0.0 /100 | #331 | Tragic 18.8% |
| Immigrants | Sudan | 0.0 /100 | #332 | Tragic 18.8% |
| Immigrants | Yemen | 0.0 /100 | #333 | Tragic 18.8% |
| Sudanese | 0.0 /100 | #334 | Tragic 18.9% |
| Senegalese | 0.0 /100 | #335 | Tragic 19.0% |
| Blacks/African Americans | 0.0 /100 | #336 | Tragic 19.0% |
| Immigrants | Saudi Arabia | 0.0 /100 | #337 | Tragic 19.1% |
| Lumbee | 0.0 /100 | #338 | Tragic 19.1% |
| Puerto Ricans | 0.0 /100 | #339 | Tragic 19.2% |
| Cape Verdeans | 0.0 /100 | #340 | Tragic 19.2% |
| Tohono O'odham | 0.0 /100 | #341 | Tragic 19.3% |
| Houma | 0.0 /100 | #342 | Tragic 19.3% |
| Immigrants | Zaire | 0.0 /100 | #343 | Tragic 19.4% |
| Immigrants | Congo | 0.0 /100 | #344 | Tragic 19.7% |
Demographics Similar to South Africans by Cognitive Disability
In terms of cognitive disability, the demographic groups most similar to South Africans are Scottish (16.9%, a difference of 0.080%), Immigrants from China (16.9%, a difference of 0.10%), Immigrants from Western Europe (16.9%, a difference of 0.12%), Immigrants from Japan (16.9%, a difference of 0.13%), and Immigrants from Denmark (16.9%, a difference of 0.13%).
| Demographics | Rating | Rank | Cognitive Disability |
| Indians (Asian) | 97.2 /100 | #112 | Exceptional 16.8% |
| Immigrants | Sri Lanka | 97.1 /100 | #113 | Exceptional 16.8% |
| Koreans | 97.1 /100 | #114 | Exceptional 16.8% |
| Yup'ik | 96.9 /100 | #115 | Exceptional 16.9% |
| Inupiat | 96.5 /100 | #116 | Exceptional 16.9% |
| Immigrants | Japan | 96.2 /100 | #117 | Exceptional 16.9% |
| Immigrants | Denmark | 96.2 /100 | #118 | Exceptional 16.9% |
| South Africans | 95.5 /100 | #119 | Exceptional 16.9% |
| Scottish | 95.0 /100 | #120 | Exceptional 16.9% |
| Immigrants | China | 94.9 /100 | #121 | Exceptional 16.9% |
| Immigrants | Western Europe | 94.8 /100 | #122 | Exceptional 16.9% |
| Portuguese | 94.7 /100 | #123 | Exceptional 16.9% |
| Turks | 94.5 /100 | #124 | Exceptional 16.9% |
| Scandinavians | 94.1 /100 | #125 | Exceptional 16.9% |
| Europeans | 93.4 /100 | #126 | Exceptional 17.0% |