Immigrants from Singapore vs Iroquois Disability Age 5 to 17
COMPARE
Immigrants from Singapore
Iroquois
Disability Age 5 to 17
Disability Age 5 to 17 Comparison
Immigrants from Singapore
Iroquois
4.7%
DISABILITY AGE 5 TO 17
100.0/ 100
METRIC RATING
16th/ 347
METRIC RANK
6.9%
DISABILITY AGE 5 TO 17
0.0/ 100
METRIC RATING
338th/ 347
METRIC RANK
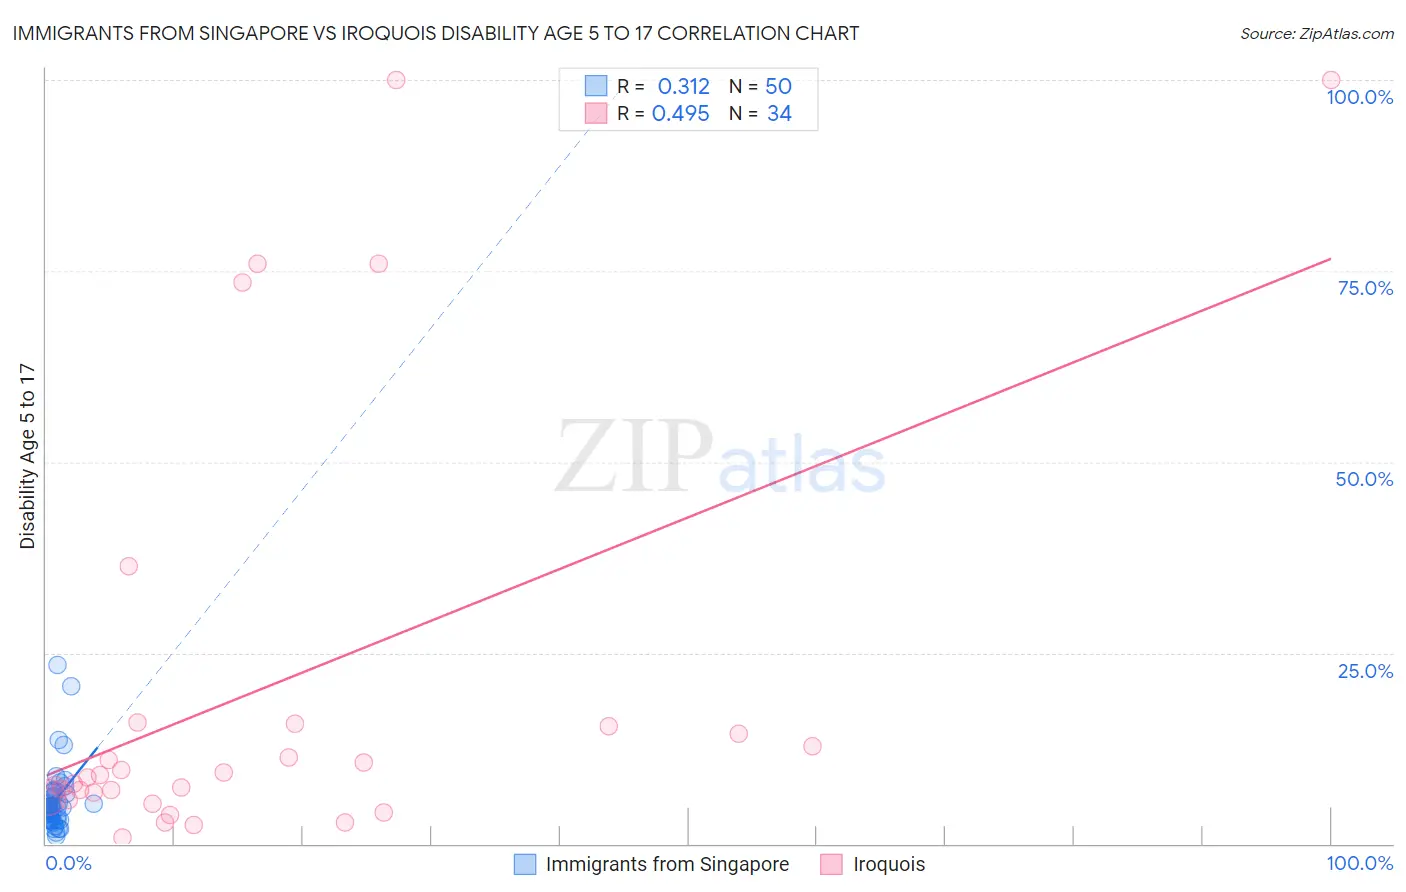
Immigrants from Singapore vs Iroquois Disability Age 5 to 17 Correlation Chart
The statistical analysis conducted on geographies consisting of 136,920,724 people shows a mild positive correlation between the proportion of Immigrants from Singapore and percentage of population with a disability between the ages 5 and 17 in the United States with a correlation coefficient (R) of 0.312 and weighted average of 4.7%. Similarly, the statistical analysis conducted on geographies consisting of 206,302,830 people shows a moderate positive correlation between the proportion of Iroquois and percentage of population with a disability between the ages 5 and 17 in the United States with a correlation coefficient (R) of 0.495 and weighted average of 6.9%, a difference of 46.0%.
Disability Age 5 to 17 Correlation Summary
| Measurement | Immigrants from Singapore | Iroquois |
| Minimum | 1.1% | 0.85% |
| Maximum | 23.4% | 100.0% |
| Range | 22.4% | 99.1% |
| Mean | 5.6% | 20.3% |
| Median | 4.7% | 8.9% |
| Interquartile 25% (IQ1) | 3.1% | 6.0% |
| Interquartile 75% (IQ3) | 6.6% | 15.4% |
| Interquartile Range (IQR) | 3.5% | 9.3% |
| Standard Deviation (Sample) | 4.2% | 28.4% |
| Standard Deviation (Population) | 4.1% | 28.0% |
Similar Demographics by Disability Age 5 to 17
Demographics Similar to Immigrants from Singapore by Disability Age 5 to 17
In terms of disability age 5 to 17, the demographic groups most similar to Immigrants from Singapore are Chinese (4.7%, a difference of 0.42%), Arapaho (4.7%, a difference of 0.46%), Immigrants from South Central Asia (4.7%, a difference of 0.48%), Immigrants from Korea (4.7%, a difference of 0.63%), and Immigrants from Uzbekistan (4.8%, a difference of 0.97%).
| Demographics | Rating | Rank | Disability Age 5 to 17 |
| Immigrants | Eastern Asia | 100.0 /100 | #9 | Exceptional 4.6% |
| Immigrants | India | 100.0 /100 | #10 | Exceptional 4.6% |
| Armenians | 100.0 /100 | #11 | Exceptional 4.6% |
| Iranians | 100.0 /100 | #12 | Exceptional 4.6% |
| Thais | 100.0 /100 | #13 | Exceptional 4.7% |
| Immigrants | Korea | 100.0 /100 | #14 | Exceptional 4.7% |
| Chinese | 100.0 /100 | #15 | Exceptional 4.7% |
| Immigrants | Singapore | 100.0 /100 | #16 | Exceptional 4.7% |
| Arapaho | 100.0 /100 | #17 | Exceptional 4.7% |
| Immigrants | South Central Asia | 100.0 /100 | #18 | Exceptional 4.7% |
| Immigrants | Uzbekistan | 100.0 /100 | #19 | Exceptional 4.8% |
| Burmese | 100.0 /100 | #20 | Exceptional 4.8% |
| Yup'ik | 100.0 /100 | #21 | Exceptional 4.8% |
| Asians | 100.0 /100 | #22 | Exceptional 4.8% |
| Immigrants | Bolivia | 100.0 /100 | #23 | Exceptional 4.8% |
Demographics Similar to Iroquois by Disability Age 5 to 17
In terms of disability age 5 to 17, the demographic groups most similar to Iroquois are Creek (6.9%, a difference of 0.24%), Choctaw (6.9%, a difference of 0.33%), Cherokee (6.9%, a difference of 0.59%), Chickasaw (6.8%, a difference of 0.68%), and Cape Verdean (7.0%, a difference of 1.1%).
| Demographics | Rating | Rank | Disability Age 5 to 17 |
| French Canadians | 0.0 /100 | #331 | Tragic 6.7% |
| Immigrants | Azores | 0.0 /100 | #332 | Tragic 6.7% |
| Blacks/African Americans | 0.0 /100 | #333 | Tragic 6.8% |
| Seminole | 0.0 /100 | #334 | Tragic 6.8% |
| Ottawa | 0.0 /100 | #335 | Tragic 6.8% |
| Chickasaw | 0.0 /100 | #336 | Tragic 6.8% |
| Creek | 0.0 /100 | #337 | Tragic 6.9% |
| Iroquois | 0.0 /100 | #338 | Tragic 6.9% |
| Choctaw | 0.0 /100 | #339 | Tragic 6.9% |
| Cherokee | 0.0 /100 | #340 | Tragic 6.9% |
| Cape Verdeans | 0.0 /100 | #341 | Tragic 7.0% |
| Chippewa | 0.0 /100 | #342 | Tragic 7.1% |
| Immigrants | Cabo Verde | 0.0 /100 | #343 | Tragic 7.1% |
| Cajuns | 0.0 /100 | #344 | Tragic 7.2% |
| Tsimshian | 0.0 /100 | #345 | Tragic 7.9% |