Immigrants from Singapore vs Estonian Disability Age 5 to 17
COMPARE
Immigrants from Singapore
Estonian
Disability Age 5 to 17
Disability Age 5 to 17 Comparison
Immigrants from Singapore
Estonians
4.7%
DISABILITY AGE 5 TO 17
100.0/ 100
METRIC RATING
16th/ 347
METRIC RANK
5.5%
DISABILITY AGE 5 TO 17
80.8/ 100
METRIC RATING
151st/ 347
METRIC RANK
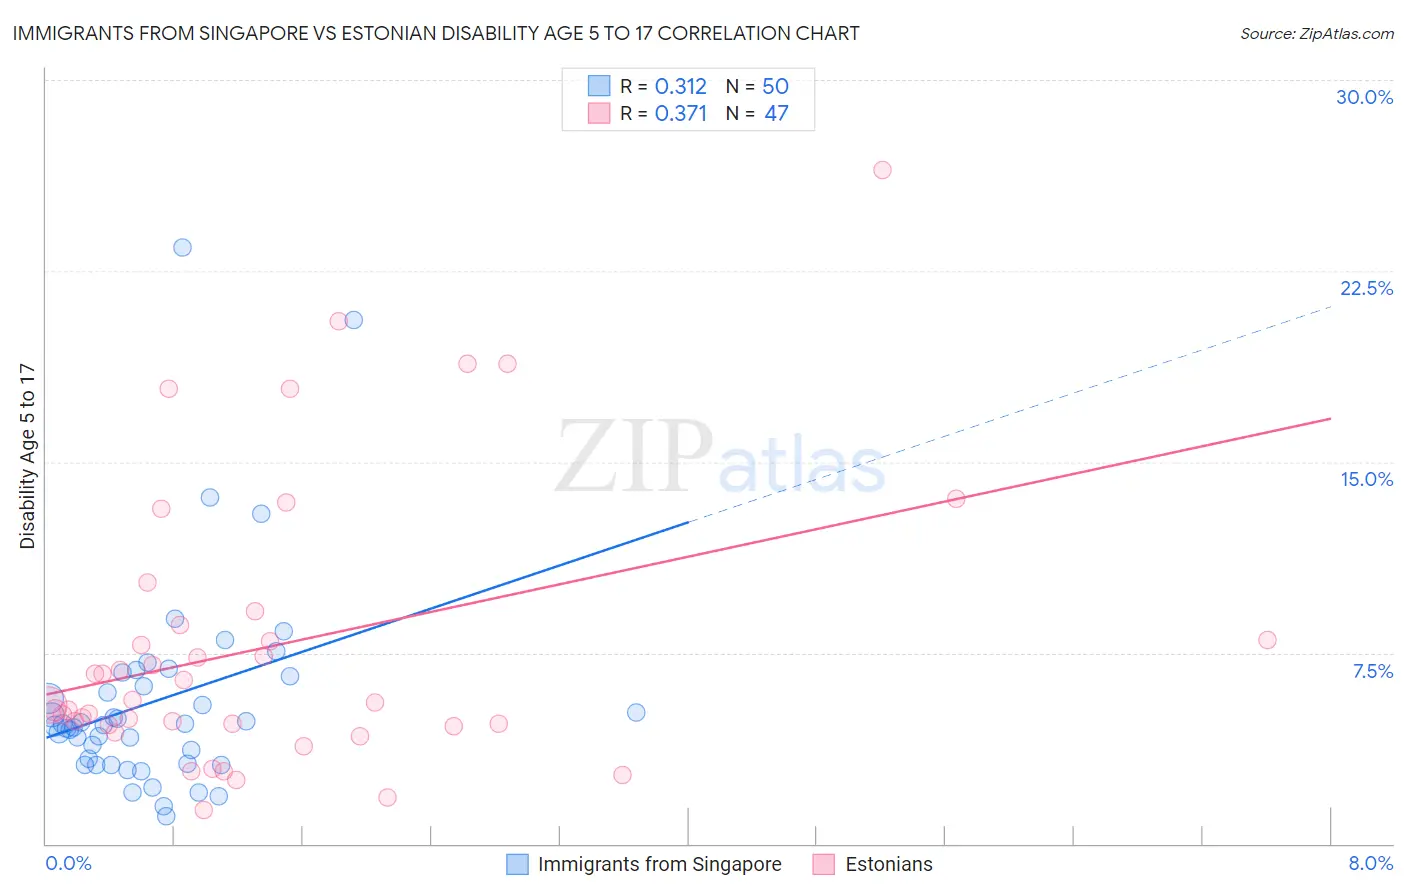
Immigrants from Singapore vs Estonian Disability Age 5 to 17 Correlation Chart
The statistical analysis conducted on geographies consisting of 136,920,724 people shows a mild positive correlation between the proportion of Immigrants from Singapore and percentage of population with a disability between the ages 5 and 17 in the United States with a correlation coefficient (R) of 0.312 and weighted average of 4.7%. Similarly, the statistical analysis conducted on geographies consisting of 122,980,183 people shows a mild positive correlation between the proportion of Estonians and percentage of population with a disability between the ages 5 and 17 in the United States with a correlation coefficient (R) of 0.371 and weighted average of 5.5%, a difference of 16.7%.
Disability Age 5 to 17 Correlation Summary
| Measurement | Immigrants from Singapore | Estonian |
| Minimum | 1.1% | 1.3% |
| Maximum | 23.4% | 26.5% |
| Range | 22.4% | 25.2% |
| Mean | 5.6% | 7.8% |
| Median | 4.7% | 5.5% |
| Interquartile 25% (IQ1) | 3.1% | 4.7% |
| Interquartile 75% (IQ3) | 6.6% | 8.6% |
| Interquartile Range (IQR) | 3.5% | 3.9% |
| Standard Deviation (Sample) | 4.2% | 5.6% |
| Standard Deviation (Population) | 4.1% | 5.5% |
Similar Demographics by Disability Age 5 to 17
Demographics Similar to Immigrants from Singapore by Disability Age 5 to 17
In terms of disability age 5 to 17, the demographic groups most similar to Immigrants from Singapore are Chinese (4.7%, a difference of 0.42%), Arapaho (4.7%, a difference of 0.46%), Immigrants from South Central Asia (4.7%, a difference of 0.48%), Immigrants from Korea (4.7%, a difference of 0.63%), and Immigrants from Uzbekistan (4.8%, a difference of 0.97%).
| Demographics | Rating | Rank | Disability Age 5 to 17 |
| Immigrants | Eastern Asia | 100.0 /100 | #9 | Exceptional 4.6% |
| Immigrants | India | 100.0 /100 | #10 | Exceptional 4.6% |
| Armenians | 100.0 /100 | #11 | Exceptional 4.6% |
| Iranians | 100.0 /100 | #12 | Exceptional 4.6% |
| Thais | 100.0 /100 | #13 | Exceptional 4.7% |
| Immigrants | Korea | 100.0 /100 | #14 | Exceptional 4.7% |
| Chinese | 100.0 /100 | #15 | Exceptional 4.7% |
| Immigrants | Singapore | 100.0 /100 | #16 | Exceptional 4.7% |
| Arapaho | 100.0 /100 | #17 | Exceptional 4.7% |
| Immigrants | South Central Asia | 100.0 /100 | #18 | Exceptional 4.7% |
| Immigrants | Uzbekistan | 100.0 /100 | #19 | Exceptional 4.8% |
| Burmese | 100.0 /100 | #20 | Exceptional 4.8% |
| Yup'ik | 100.0 /100 | #21 | Exceptional 4.8% |
| Asians | 100.0 /100 | #22 | Exceptional 4.8% |
| Immigrants | Bolivia | 100.0 /100 | #23 | Exceptional 4.8% |
Demographics Similar to Estonians by Disability Age 5 to 17
In terms of disability age 5 to 17, the demographic groups most similar to Estonians are Ute (5.5%, a difference of 0.010%), Guatemalan (5.5%, a difference of 0.060%), Central American (5.5%, a difference of 0.070%), Ecuadorian (5.5%, a difference of 0.080%), and Samoan (5.5%, a difference of 0.10%).
| Demographics | Rating | Rank | Disability Age 5 to 17 |
| Pakistanis | 87.3 /100 | #144 | Excellent 5.5% |
| Immigrants | Guatemala | 86.6 /100 | #145 | Excellent 5.5% |
| Albanians | 83.7 /100 | #146 | Excellent 5.5% |
| Immigrants | Albania | 83.1 /100 | #147 | Excellent 5.5% |
| Samoans | 81.9 /100 | #148 | Excellent 5.5% |
| Central Americans | 81.6 /100 | #149 | Excellent 5.5% |
| Guatemalans | 81.5 /100 | #150 | Excellent 5.5% |
| Estonians | 80.8 /100 | #151 | Excellent 5.5% |
| Ute | 80.6 /100 | #152 | Excellent 5.5% |
| Ecuadorians | 79.7 /100 | #153 | Good 5.5% |
| Australians | 78.8 /100 | #154 | Good 5.5% |
| Immigrants | Ecuador | 78.3 /100 | #155 | Good 5.5% |
| Hawaiians | 78.0 /100 | #156 | Good 5.5% |
| Immigrants | Costa Rica | 77.9 /100 | #157 | Good 5.5% |
| Immigrants | Nepal | 77.1 /100 | #158 | Good 5.5% |