Immigrants from Singapore vs Iroquois 9th Grade
COMPARE
Immigrants from Singapore
Iroquois
9th Grade
9th Grade Comparison
Immigrants from Singapore
Iroquois
95.8%
9TH GRADE
99.5/ 100
METRIC RATING
73rd/ 347
METRIC RANK
95.4%
9TH GRADE
96.2/ 100
METRIC RATING
113th/ 347
METRIC RANK
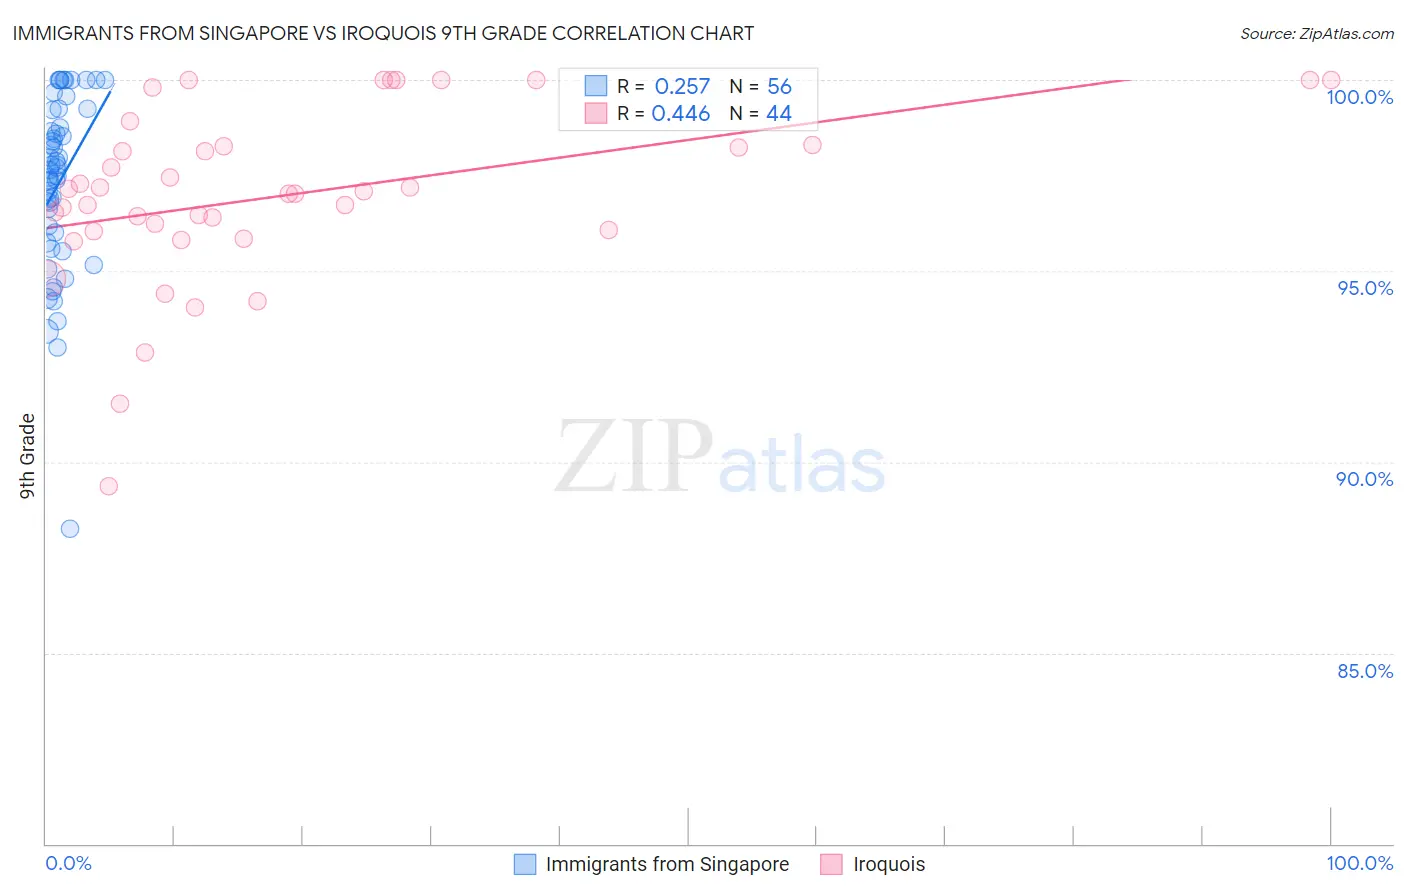
Immigrants from Singapore vs Iroquois 9th Grade Correlation Chart
The statistical analysis conducted on geographies consisting of 137,521,094 people shows a weak positive correlation between the proportion of Immigrants from Singapore and percentage of population with at least 9th grade education in the United States with a correlation coefficient (R) of 0.257 and weighted average of 95.8%. Similarly, the statistical analysis conducted on geographies consisting of 207,308,056 people shows a moderate positive correlation between the proportion of Iroquois and percentage of population with at least 9th grade education in the United States with a correlation coefficient (R) of 0.446 and weighted average of 95.4%, a difference of 0.39%.
9th Grade Correlation Summary
| Measurement | Immigrants from Singapore | Iroquois |
| Minimum | 88.3% | 89.4% |
| Maximum | 100.0% | 100.0% |
| Range | 11.7% | 10.6% |
| Mean | 97.3% | 97.0% |
| Median | 97.7% | 97.0% |
| Interquartile 25% (IQ1) | 95.9% | 96.1% |
| Interquartile 75% (IQ3) | 99.0% | 98.3% |
| Interquartile Range (IQR) | 3.1% | 2.2% |
| Standard Deviation (Sample) | 2.3% | 2.3% |
| Standard Deviation (Population) | 2.3% | 2.3% |
Similar Demographics by 9th Grade
Demographics Similar to Immigrants from Singapore by 9th Grade
In terms of 9th grade, the demographic groups most similar to Immigrants from Singapore are Immigrants from Belgium (95.8%, a difference of 0.0%), Turkish (95.8%, a difference of 0.0%), Immigrants from Australia (95.8%, a difference of 0.010%), Thai (95.8%, a difference of 0.010%), and Inupiat (95.8%, a difference of 0.020%).
| Demographics | Rating | Rank | 9th Grade |
| Immigrants | Netherlands | 99.6 /100 | #66 | Exceptional 95.8% |
| Cypriots | 99.6 /100 | #67 | Exceptional 95.8% |
| Immigrants | Ireland | 99.6 /100 | #68 | Exceptional 95.8% |
| Immigrants | Lithuania | 99.6 /100 | #69 | Exceptional 95.8% |
| Immigrants | Australia | 99.5 /100 | #70 | Exceptional 95.8% |
| Immigrants | Belgium | 99.5 /100 | #71 | Exceptional 95.8% |
| Turks | 99.5 /100 | #72 | Exceptional 95.8% |
| Immigrants | Singapore | 99.5 /100 | #73 | Exceptional 95.8% |
| Thais | 99.5 /100 | #74 | Exceptional 95.8% |
| Inupiat | 99.5 /100 | #75 | Exceptional 95.8% |
| Immigrants | Sweden | 99.5 /100 | #76 | Exceptional 95.8% |
| Whites/Caucasians | 99.4 /100 | #77 | Exceptional 95.8% |
| Immigrants | South Africa | 99.4 /100 | #78 | Exceptional 95.8% |
| Romanians | 99.3 /100 | #79 | Exceptional 95.7% |
| Bhutanese | 99.3 /100 | #80 | Exceptional 95.7% |
Demographics Similar to Iroquois by 9th Grade
In terms of 9th grade, the demographic groups most similar to Iroquois are Immigrants from Croatia (95.4%, a difference of 0.0%), German Russian (95.4%, a difference of 0.0%), Cherokee (95.4%, a difference of 0.010%), Burmese (95.4%, a difference of 0.010%), and Immigrants from Europe (95.4%, a difference of 0.020%).
| Demographics | Rating | Rank | 9th Grade |
| Immigrants | Norway | 97.1 /100 | #106 | Exceptional 95.5% |
| Immigrants | Zimbabwe | 96.9 /100 | #107 | Exceptional 95.5% |
| Chickasaw | 96.8 /100 | #108 | Exceptional 95.5% |
| Osage | 96.8 /100 | #109 | Exceptional 95.5% |
| Immigrants | Bulgaria | 96.7 /100 | #110 | Exceptional 95.5% |
| Cherokee | 96.3 /100 | #111 | Exceptional 95.4% |
| Immigrants | Croatia | 96.2 /100 | #112 | Exceptional 95.4% |
| Iroquois | 96.2 /100 | #113 | Exceptional 95.4% |
| German Russians | 96.1 /100 | #114 | Exceptional 95.4% |
| Burmese | 96.0 /100 | #115 | Exceptional 95.4% |
| Immigrants | Europe | 95.7 /100 | #116 | Exceptional 95.4% |
| Immigrants | Romania | 95.6 /100 | #117 | Exceptional 95.4% |
| Immigrants | Turkey | 95.6 /100 | #118 | Exceptional 95.4% |
| Soviet Union | 95.6 /100 | #119 | Exceptional 95.4% |
| Cambodians | 95.6 /100 | #120 | Exceptional 95.4% |