Immigrants from Singapore vs Scandinavian Male Disability
COMPARE
Immigrants from Singapore
Scandinavian
Male Disability
Male Disability Comparison
Immigrants from Singapore
Scandinavians
9.5%
MALE DISABILITY
100.0/ 100
METRIC RATING
9th/ 347
METRIC RANK
12.3%
MALE DISABILITY
0.1/ 100
METRIC RATING
271st/ 347
METRIC RANK
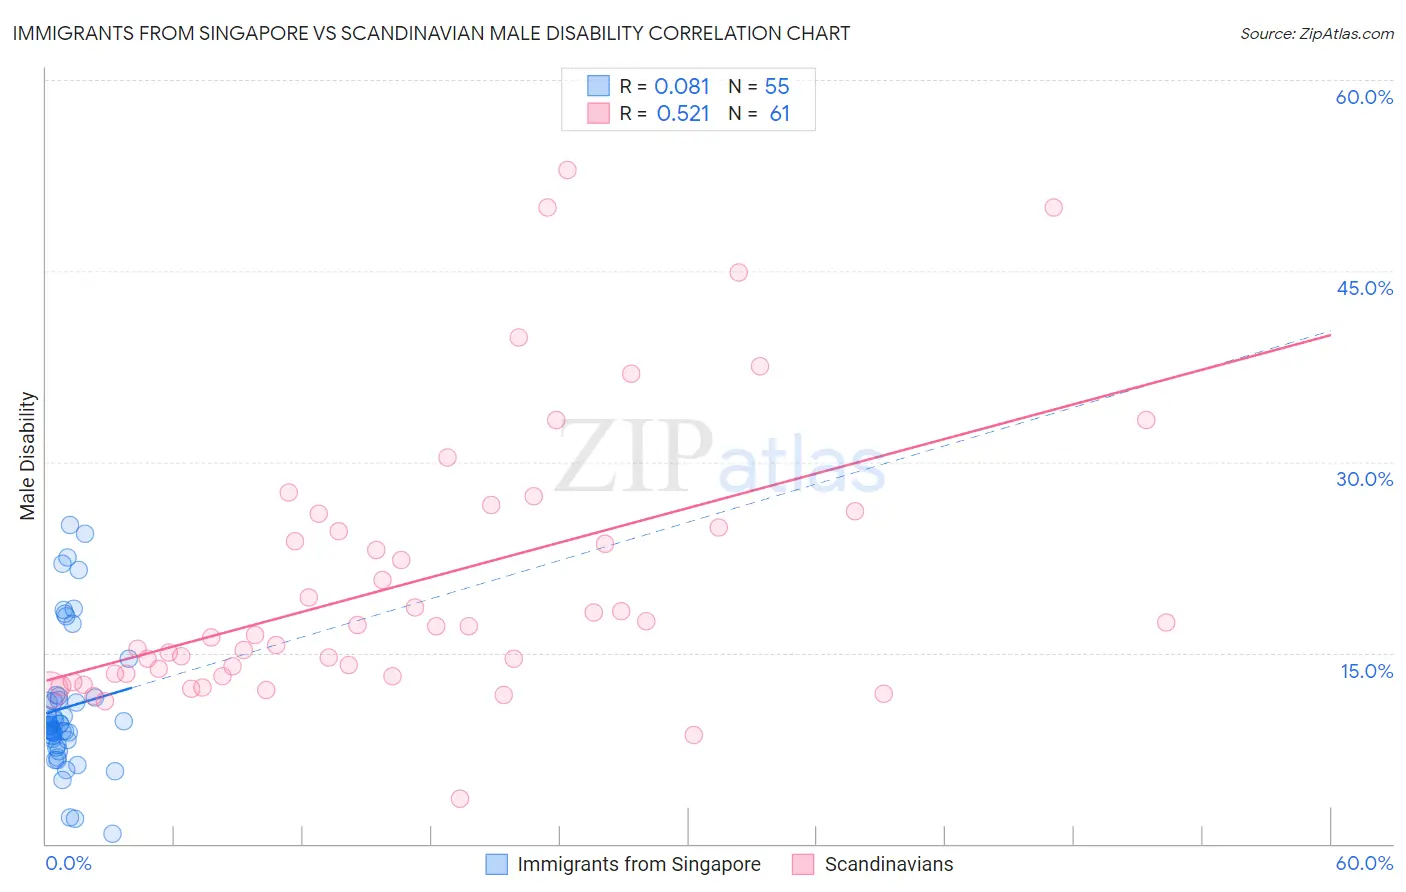
Immigrants from Singapore vs Scandinavian Male Disability Correlation Chart
The statistical analysis conducted on geographies consisting of 137,518,836 people shows a slight positive correlation between the proportion of Immigrants from Singapore and percentage of males with a disability in the United States with a correlation coefficient (R) of 0.081 and weighted average of 9.5%. Similarly, the statistical analysis conducted on geographies consisting of 472,512,703 people shows a substantial positive correlation between the proportion of Scandinavians and percentage of males with a disability in the United States with a correlation coefficient (R) of 0.521 and weighted average of 12.3%, a difference of 29.3%.
Male Disability Correlation Summary
| Measurement | Immigrants from Singapore | Scandinavian |
| Minimum | 0.75% | 3.5% |
| Maximum | 25.0% | 52.9% |
| Range | 24.2% | 49.4% |
| Mean | 10.7% | 20.6% |
| Median | 9.3% | 17.0% |
| Interquartile 25% (IQ1) | 8.2% | 13.3% |
| Interquartile 75% (IQ3) | 11.5% | 25.4% |
| Interquartile Range (IQR) | 3.4% | 12.1% |
| Standard Deviation (Sample) | 5.4% | 10.7% |
| Standard Deviation (Population) | 5.3% | 10.7% |
Similar Demographics by Male Disability
Demographics Similar to Immigrants from Singapore by Male Disability
In terms of male disability, the demographic groups most similar to Immigrants from Singapore are Immigrants from China (9.5%, a difference of 0.080%), Immigrants from Israel (9.6%, a difference of 0.43%), Immigrants from Bolivia (9.5%, a difference of 0.68%), Immigrants from Eastern Asia (9.6%, a difference of 0.98%), and Immigrants from South Central Asia (9.4%, a difference of 1.0%).
| Demographics | Rating | Rank | Male Disability |
| Immigrants | Taiwan | 100.0 /100 | #2 | Exceptional 9.1% |
| Filipinos | 100.0 /100 | #3 | Exceptional 9.1% |
| Thais | 100.0 /100 | #4 | Exceptional 9.2% |
| Immigrants | Hong Kong | 100.0 /100 | #5 | Exceptional 9.4% |
| Immigrants | South Central Asia | 100.0 /100 | #6 | Exceptional 9.4% |
| Immigrants | Bolivia | 100.0 /100 | #7 | Exceptional 9.5% |
| Immigrants | China | 100.0 /100 | #8 | Exceptional 9.5% |
| Immigrants | Singapore | 100.0 /100 | #9 | Exceptional 9.5% |
| Immigrants | Israel | 100.0 /100 | #10 | Exceptional 9.6% |
| Immigrants | Eastern Asia | 100.0 /100 | #11 | Exceptional 9.6% |
| Bolivians | 100.0 /100 | #12 | Exceptional 9.6% |
| Iranians | 100.0 /100 | #13 | Exceptional 9.7% |
| Immigrants | Iran | 100.0 /100 | #14 | Exceptional 9.7% |
| Indians (Asian) | 100.0 /100 | #15 | Exceptional 9.7% |
| Okinawans | 100.0 /100 | #16 | Exceptional 9.8% |
Demographics Similar to Scandinavians by Male Disability
In terms of male disability, the demographic groups most similar to Scandinavians are Spaniard (12.3%, a difference of 0.19%), Portuguese (12.3%, a difference of 0.27%), Czechoslovakian (12.3%, a difference of 0.27%), Immigrants from Germany (12.3%, a difference of 0.40%), and Hawaiian (12.3%, a difference of 0.45%).
| Demographics | Rating | Rank | Male Disability |
| Nepalese | 0.2 /100 | #264 | Tragic 12.2% |
| Immigrants | Portugal | 0.1 /100 | #265 | Tragic 12.3% |
| Hawaiians | 0.1 /100 | #266 | Tragic 12.3% |
| Immigrants | Germany | 0.1 /100 | #267 | Tragic 12.3% |
| Portuguese | 0.1 /100 | #268 | Tragic 12.3% |
| Czechoslovakians | 0.1 /100 | #269 | Tragic 12.3% |
| Spaniards | 0.1 /100 | #270 | Tragic 12.3% |
| Scandinavians | 0.1 /100 | #271 | Tragic 12.3% |
| Hmong | 0.0 /100 | #272 | Tragic 12.5% |
| Native Hawaiians | 0.0 /100 | #273 | Tragic 12.5% |
| Hopi | 0.0 /100 | #274 | Tragic 12.5% |
| Fijians | 0.0 /100 | #275 | Tragic 12.6% |
| Africans | 0.0 /100 | #276 | Tragic 12.6% |
| Finns | 0.0 /100 | #277 | Tragic 12.6% |
| Central American Indians | 0.0 /100 | #278 | Tragic 12.7% |