Immigrants from Sierra Leone vs Immigrants from Scotland Self-Care Disability
COMPARE
Immigrants from Sierra Leone
Immigrants from Scotland
Self-Care Disability
Self-Care Disability Comparison
Immigrants from Sierra Leone
Immigrants from Scotland
2.4%
SELF-CARE DISABILITY
91.8/ 100
METRIC RATING
119th/ 347
METRIC RANK
2.4%
SELF-CARE DISABILITY
95.7/ 100
METRIC RATING
101st/ 347
METRIC RANK
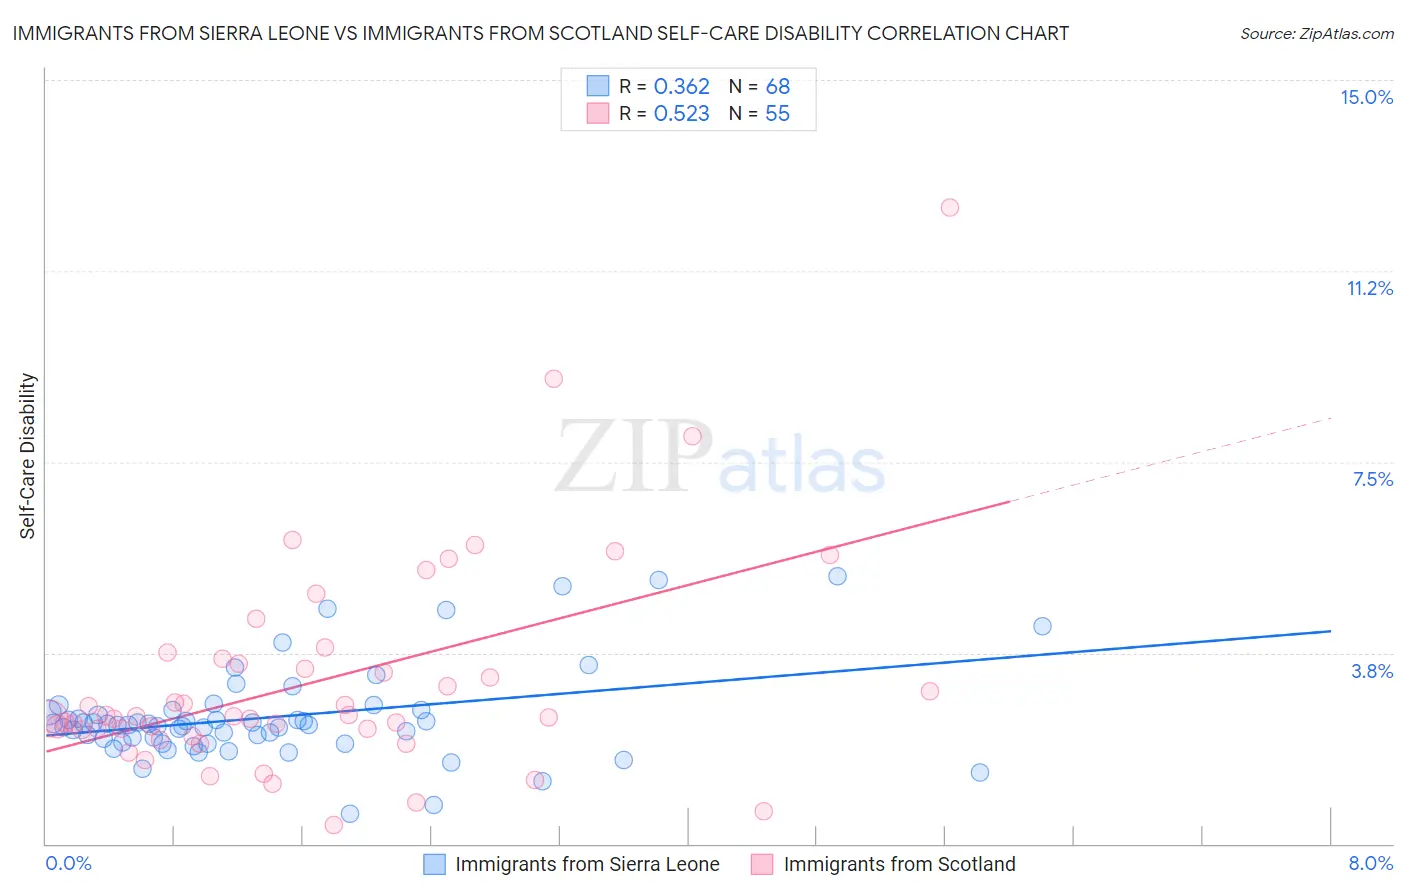
Immigrants from Sierra Leone vs Immigrants from Scotland Self-Care Disability Correlation Chart
The statistical analysis conducted on geographies consisting of 101,626,227 people shows a mild positive correlation between the proportion of Immigrants from Sierra Leone and percentage of population with self-care disability in the United States with a correlation coefficient (R) of 0.362 and weighted average of 2.4%. Similarly, the statistical analysis conducted on geographies consisting of 196,308,216 people shows a substantial positive correlation between the proportion of Immigrants from Scotland and percentage of population with self-care disability in the United States with a correlation coefficient (R) of 0.523 and weighted average of 2.4%, a difference of 0.84%.
Self-Care Disability Correlation Summary
| Measurement | Immigrants from Sierra Leone | Immigrants from Scotland |
| Minimum | 0.59% | 0.37% |
| Maximum | 5.3% | 12.5% |
| Range | 4.7% | 12.1% |
| Mean | 2.5% | 3.2% |
| Median | 2.3% | 2.5% |
| Interquartile 25% (IQ1) | 2.0% | 2.2% |
| Interquartile 75% (IQ3) | 2.6% | 3.6% |
| Interquartile Range (IQR) | 0.58% | 1.4% |
| Standard Deviation (Sample) | 0.92% | 2.1% |
| Standard Deviation (Population) | 0.91% | 2.1% |
Demographics Similar to Immigrants from Sierra Leone and Immigrants from Scotland by Self-Care Disability
In terms of self-care disability, the demographic groups most similar to Immigrants from Sierra Leone are Immigrants from Canada (2.4%, a difference of 0.030%), Uruguayan (2.4%, a difference of 0.050%), Taiwanese (2.4%, a difference of 0.12%), Northern European (2.4%, a difference of 0.19%), and Immigrants from North Macedonia (2.4%, a difference of 0.24%). Similarly, the demographic groups most similar to Immigrants from Scotland are European (2.4%, a difference of 0.040%), Croatian (2.4%, a difference of 0.18%), Alsatian (2.4%, a difference of 0.21%), Bhutanese (2.4%, a difference of 0.31%), and Carpatho Rusyn (2.4%, a difference of 0.35%).
| Demographics | Rating | Rank | Self-Care Disability |
| Europeans | 95.8 /100 | #100 | Exceptional 2.4% |
| Immigrants | Scotland | 95.7 /100 | #101 | Exceptional 2.4% |
| Croatians | 95.0 /100 | #102 | Exceptional 2.4% |
| Alsatians | 94.9 /100 | #103 | Exceptional 2.4% |
| Bhutanese | 94.5 /100 | #104 | Exceptional 2.4% |
| Carpatho Rusyns | 94.4 /100 | #105 | Exceptional 2.4% |
| Immigrants | Indonesia | 94.3 /100 | #106 | Exceptional 2.4% |
| British | 94.3 /100 | #107 | Exceptional 2.4% |
| Greeks | 94.1 /100 | #108 | Exceptional 2.4% |
| Slovenes | 94.1 /100 | #109 | Exceptional 2.4% |
| Immigrants | Africa | 93.7 /100 | #110 | Exceptional 2.4% |
| Serbians | 93.6 /100 | #111 | Exceptional 2.4% |
| Scandinavians | 93.5 /100 | #112 | Exceptional 2.4% |
| South Americans | 93.2 /100 | #113 | Exceptional 2.4% |
| Immigrants | North Macedonia | 93.1 /100 | #114 | Exceptional 2.4% |
| Immigrants | Hong Kong | 93.1 /100 | #115 | Exceptional 2.4% |
| Northern Europeans | 92.9 /100 | #116 | Exceptional 2.4% |
| Taiwanese | 92.5 /100 | #117 | Exceptional 2.4% |
| Immigrants | Canada | 92.0 /100 | #118 | Exceptional 2.4% |
| Immigrants | Sierra Leone | 91.8 /100 | #119 | Exceptional 2.4% |
| Uruguayans | 91.5 /100 | #120 | Exceptional 2.4% |