Immigrants from the Azores vs Immigrants from Scotland Self-Care Disability
COMPARE
Immigrants from the Azores
Immigrants from Scotland
Self-Care Disability
Self-Care Disability Comparison
Immigrants from the Azores
Immigrants from Scotland
3.0%
SELF-CARE DISABILITY
0.0/ 100
METRIC RATING
335th/ 347
METRIC RANK
2.4%
SELF-CARE DISABILITY
95.7/ 100
METRIC RATING
101st/ 347
METRIC RANK
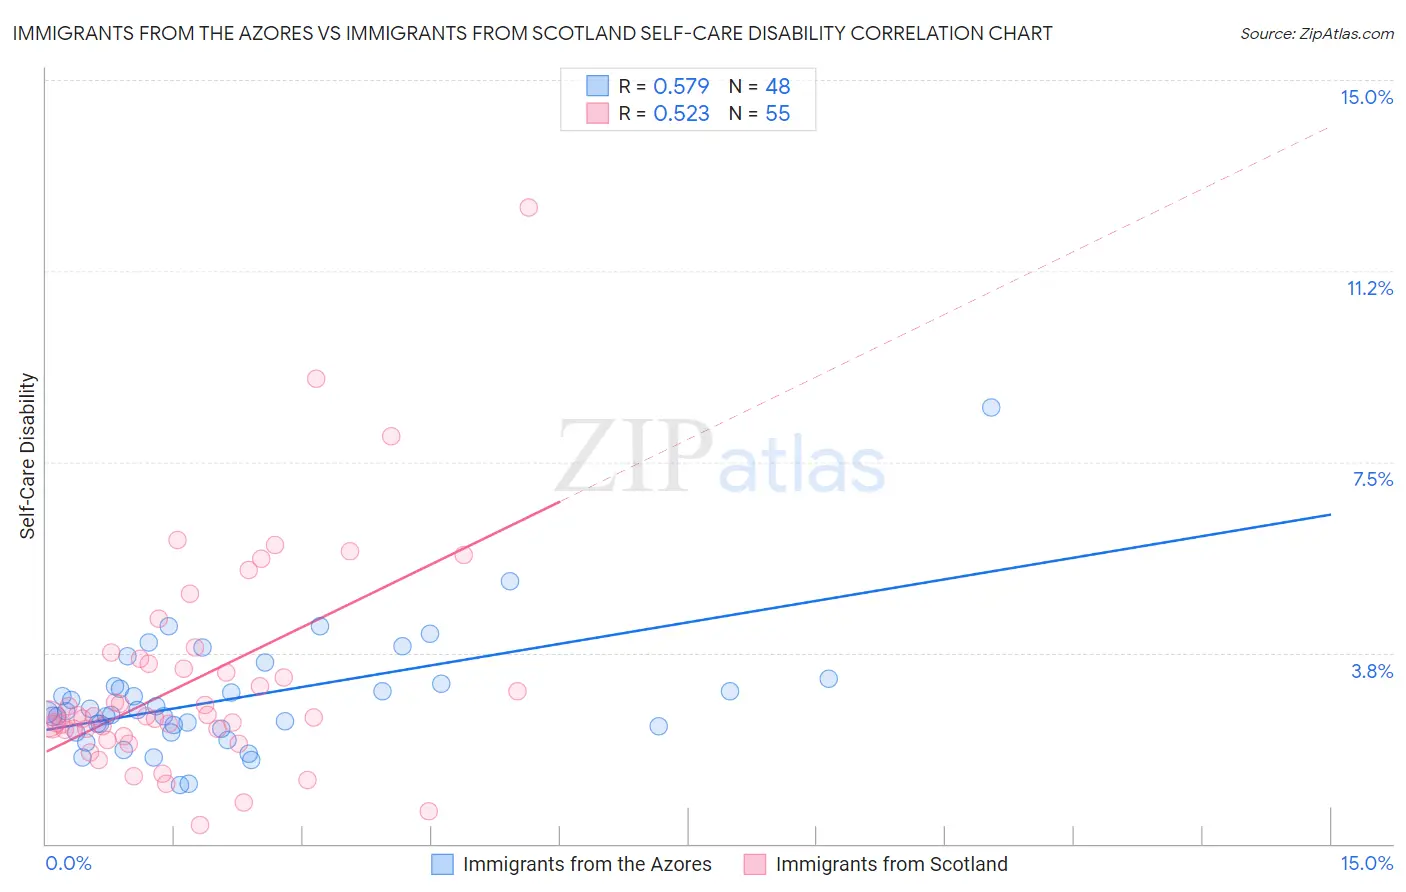
Immigrants from the Azores vs Immigrants from Scotland Self-Care Disability Correlation Chart
The statistical analysis conducted on geographies consisting of 46,255,700 people shows a substantial positive correlation between the proportion of Immigrants from the Azores and percentage of population with self-care disability in the United States with a correlation coefficient (R) of 0.579 and weighted average of 3.0%. Similarly, the statistical analysis conducted on geographies consisting of 196,308,216 people shows a substantial positive correlation between the proportion of Immigrants from Scotland and percentage of population with self-care disability in the United States with a correlation coefficient (R) of 0.523 and weighted average of 2.4%, a difference of 25.7%.
Self-Care Disability Correlation Summary
| Measurement | Immigrants from the Azores | Immigrants from Scotland |
| Minimum | 1.1% | 0.37% |
| Maximum | 8.6% | 12.5% |
| Range | 7.4% | 12.1% |
| Mean | 2.9% | 3.2% |
| Median | 2.6% | 2.5% |
| Interquartile 25% (IQ1) | 2.3% | 2.2% |
| Interquartile 75% (IQ3) | 3.1% | 3.6% |
| Interquartile Range (IQR) | 0.84% | 1.4% |
| Standard Deviation (Sample) | 1.2% | 2.1% |
| Standard Deviation (Population) | 1.2% | 2.1% |
Similar Demographics by Self-Care Disability
Demographics Similar to Immigrants from the Azores by Self-Care Disability
In terms of self-care disability, the demographic groups most similar to Immigrants from the Azores are Houma (3.0%, a difference of 0.050%), Dutch West Indian (3.0%, a difference of 0.12%), Immigrants from Yemen (3.0%, a difference of 0.16%), Kiowa (3.0%, a difference of 0.35%), and Lumbee (3.0%, a difference of 0.71%).
| Demographics | Rating | Rank | Self-Care Disability |
| Hopi | 0.0 /100 | #328 | Tragic 2.9% |
| Cajuns | 0.0 /100 | #329 | Tragic 2.9% |
| Nepalese | 0.0 /100 | #330 | Tragic 3.0% |
| Lumbee | 0.0 /100 | #331 | Tragic 3.0% |
| Kiowa | 0.0 /100 | #332 | Tragic 3.0% |
| Dutch West Indians | 0.0 /100 | #333 | Tragic 3.0% |
| Houma | 0.0 /100 | #334 | Tragic 3.0% |
| Immigrants | Azores | 0.0 /100 | #335 | Tragic 3.0% |
| Immigrants | Yemen | 0.0 /100 | #336 | Tragic 3.0% |
| Choctaw | 0.0 /100 | #337 | Tragic 3.0% |
| Cape Verdeans | 0.0 /100 | #338 | Tragic 3.0% |
| Immigrants | Dominican Republic | 0.0 /100 | #339 | Tragic 3.0% |
| Immigrants | Cabo Verde | 0.0 /100 | #340 | Tragic 3.1% |
| Dominicans | 0.0 /100 | #341 | Tragic 3.1% |
| Colville | 0.0 /100 | #342 | Tragic 3.1% |
Demographics Similar to Immigrants from Scotland by Self-Care Disability
In terms of self-care disability, the demographic groups most similar to Immigrants from Scotland are European (2.4%, a difference of 0.040%), Immigrants from Israel (2.4%, a difference of 0.15%), Croatian (2.4%, a difference of 0.18%), Alsatian (2.4%, a difference of 0.21%), and Immigrants from Poland (2.4%, a difference of 0.22%).
| Demographics | Rating | Rank | Self-Care Disability |
| Macedonians | 96.9 /100 | #94 | Exceptional 2.4% |
| Immigrants | Asia | 96.9 /100 | #95 | Exceptional 2.4% |
| Immigrants | Chile | 96.7 /100 | #96 | Exceptional 2.4% |
| Swiss | 96.6 /100 | #97 | Exceptional 2.4% |
| Immigrants | Poland | 96.4 /100 | #98 | Exceptional 2.4% |
| Immigrants | Israel | 96.1 /100 | #99 | Exceptional 2.4% |
| Europeans | 95.8 /100 | #100 | Exceptional 2.4% |
| Immigrants | Scotland | 95.7 /100 | #101 | Exceptional 2.4% |
| Croatians | 95.0 /100 | #102 | Exceptional 2.4% |
| Alsatians | 94.9 /100 | #103 | Exceptional 2.4% |
| Bhutanese | 94.5 /100 | #104 | Exceptional 2.4% |
| Carpatho Rusyns | 94.4 /100 | #105 | Exceptional 2.4% |
| Immigrants | Indonesia | 94.3 /100 | #106 | Exceptional 2.4% |
| British | 94.3 /100 | #107 | Exceptional 2.4% |
| Greeks | 94.1 /100 | #108 | Exceptional 2.4% |