Immigrants from Sierra Leone vs Immigrants from Austria Ambulatory Disability
COMPARE
Immigrants from Sierra Leone
Immigrants from Austria
Ambulatory Disability
Ambulatory Disability Comparison
Immigrants from Sierra Leone
Immigrants from Austria
5.8%
AMBULATORY DISABILITY
98.6/ 100
METRIC RATING
92nd/ 347
METRIC RANK
6.0%
AMBULATORY DISABILITY
78.8/ 100
METRIC RATING
152nd/ 347
METRIC RANK
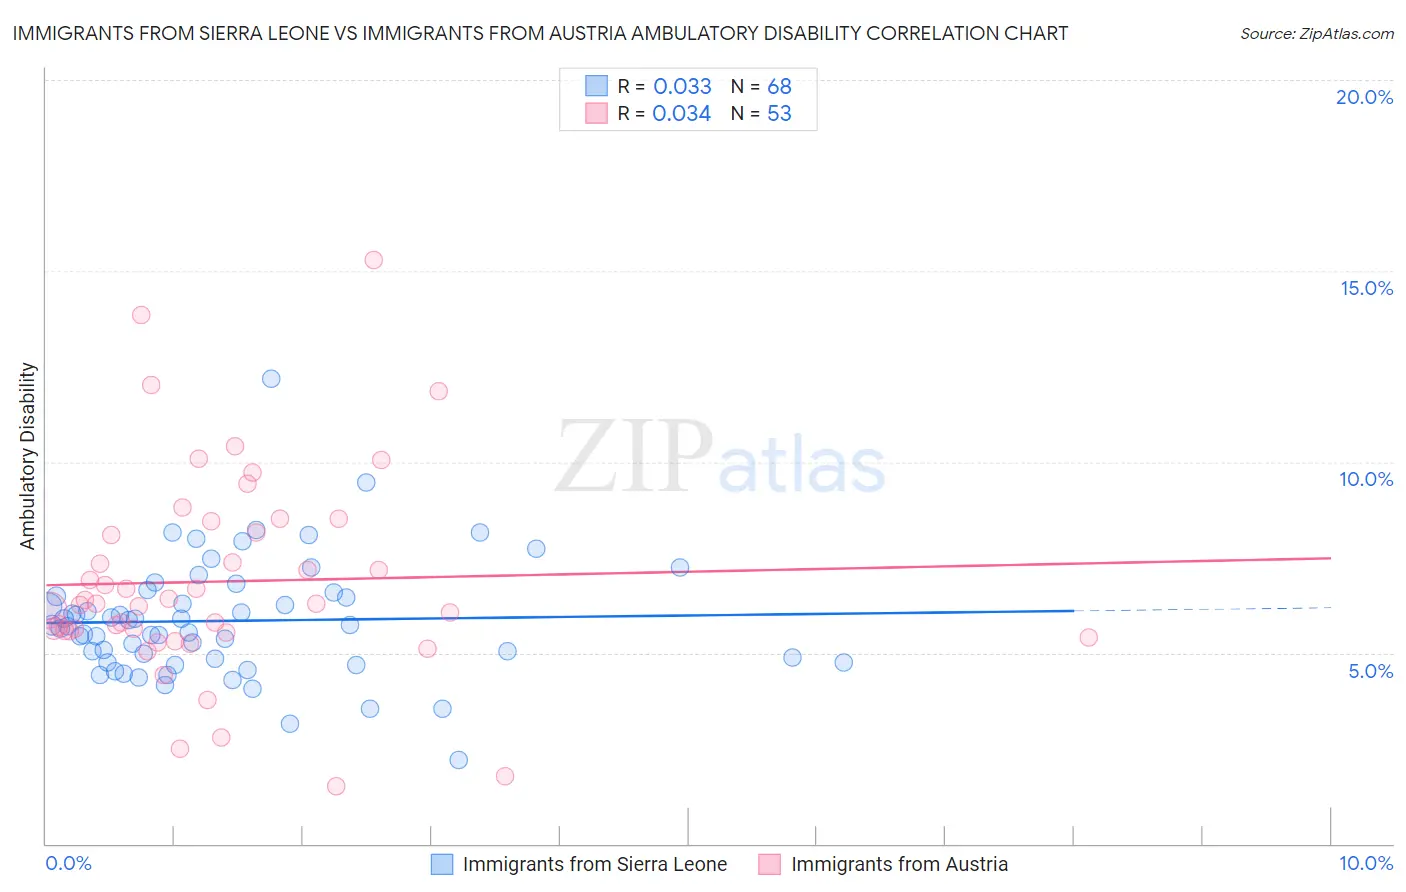
Immigrants from Sierra Leone vs Immigrants from Austria Ambulatory Disability Correlation Chart
The statistical analysis conducted on geographies consisting of 101,631,986 people shows no correlation between the proportion of Immigrants from Sierra Leone and percentage of population with ambulatory disability in the United States with a correlation coefficient (R) of 0.033 and weighted average of 5.8%. Similarly, the statistical analysis conducted on geographies consisting of 167,968,225 people shows no correlation between the proportion of Immigrants from Austria and percentage of population with ambulatory disability in the United States with a correlation coefficient (R) of 0.034 and weighted average of 6.0%, a difference of 4.2%.
Ambulatory Disability Correlation Summary
| Measurement | Immigrants from Sierra Leone | Immigrants from Austria |
| Minimum | 2.2% | 1.5% |
| Maximum | 12.2% | 15.3% |
| Range | 10.0% | 13.8% |
| Mean | 5.8% | 6.9% |
| Median | 5.7% | 6.3% |
| Interquartile 25% (IQ1) | 4.8% | 5.6% |
| Interquartile 75% (IQ3) | 6.5% | 8.3% |
| Interquartile Range (IQR) | 1.7% | 2.7% |
| Standard Deviation (Sample) | 1.6% | 2.7% |
| Standard Deviation (Population) | 1.5% | 2.7% |
Similar Demographics by Ambulatory Disability
Demographics Similar to Immigrants from Sierra Leone by Ambulatory Disability
In terms of ambulatory disability, the demographic groups most similar to Immigrants from Sierra Leone are Immigrants from Denmark (5.8%, a difference of 0.010%), Bhutanese (5.8%, a difference of 0.17%), Australian (5.8%, a difference of 0.17%), Immigrants from Sudan (5.8%, a difference of 0.17%), and Kenyan (5.8%, a difference of 0.20%).
| Demographics | Rating | Rank | Ambulatory Disability |
| South Americans | 99.0 /100 | #85 | Exceptional 5.7% |
| Latvians | 99.0 /100 | #86 | Exceptional 5.7% |
| Immigrants | Chile | 98.9 /100 | #87 | Exceptional 5.8% |
| Soviet Union | 98.9 /100 | #88 | Exceptional 5.8% |
| Bhutanese | 98.8 /100 | #89 | Exceptional 5.8% |
| Australians | 98.8 /100 | #90 | Exceptional 5.8% |
| Immigrants | Sudan | 98.8 /100 | #91 | Exceptional 5.8% |
| Immigrants | Sierra Leone | 98.6 /100 | #92 | Exceptional 5.8% |
| Immigrants | Denmark | 98.6 /100 | #93 | Exceptional 5.8% |
| Kenyans | 98.4 /100 | #94 | Exceptional 5.8% |
| Immigrants | El Salvador | 98.4 /100 | #95 | Exceptional 5.8% |
| Salvadorans | 98.4 /100 | #96 | Exceptional 5.8% |
| Immigrants | Somalia | 98.3 /100 | #97 | Exceptional 5.8% |
| Immigrants | Lebanon | 98.3 /100 | #98 | Exceptional 5.8% |
| Immigrants | Northern Europe | 98.2 /100 | #99 | Exceptional 5.8% |
Demographics Similar to Immigrants from Austria by Ambulatory Disability
In terms of ambulatory disability, the demographic groups most similar to Immigrants from Austria are Greek (6.0%, a difference of 0.070%), Maltese (6.0%, a difference of 0.25%), Syrian (6.0%, a difference of 0.25%), Lithuanian (6.0%, a difference of 0.27%), and Immigrants from Eastern Europe (6.0%, a difference of 0.28%).
| Demographics | Rating | Rank | Ambulatory Disability |
| Pakistanis | 82.5 /100 | #145 | Excellent 6.0% |
| Immigrants | Greece | 82.5 /100 | #146 | Excellent 6.0% |
| Immigrants | Moldova | 82.4 /100 | #147 | Excellent 6.0% |
| Immigrants | Eastern Europe | 82.0 /100 | #148 | Excellent 6.0% |
| Lithuanians | 81.9 /100 | #149 | Excellent 6.0% |
| Maltese | 81.6 /100 | #150 | Excellent 6.0% |
| Greeks | 79.6 /100 | #151 | Good 6.0% |
| Immigrants | Austria | 78.8 /100 | #152 | Good 6.0% |
| Syrians | 75.5 /100 | #153 | Good 6.0% |
| Immigrants | Croatia | 75.1 /100 | #154 | Good 6.0% |
| Immigrants | Scotland | 72.1 /100 | #155 | Good 6.0% |
| Northern Europeans | 71.8 /100 | #156 | Good 6.0% |
| Ghanaians | 71.3 /100 | #157 | Good 6.0% |
| Immigrants | Fiji | 71.2 /100 | #158 | Good 6.0% |
| Immigrants | Latvia | 71.1 /100 | #159 | Good 6.0% |