Immigrants from Sierra Leone vs Spanish American Ambulatory Disability
COMPARE
Immigrants from Sierra Leone
Spanish American
Ambulatory Disability
Ambulatory Disability Comparison
Immigrants from Sierra Leone
Spanish Americans
5.8%
AMBULATORY DISABILITY
98.6/ 100
METRIC RATING
92nd/ 347
METRIC RANK
7.1%
AMBULATORY DISABILITY
0.0/ 100
METRIC RATING
307th/ 347
METRIC RANK
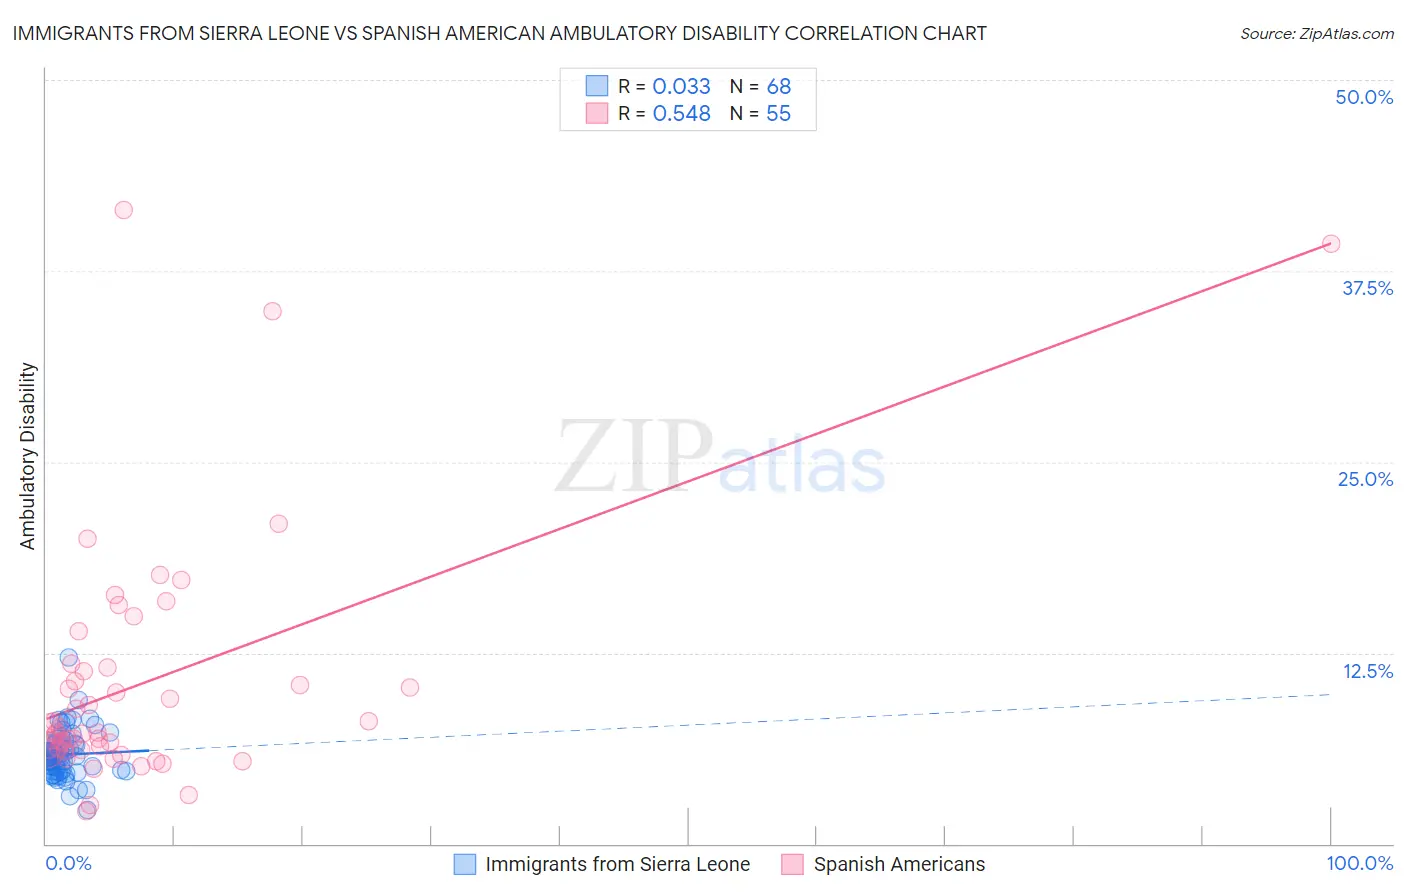
Immigrants from Sierra Leone vs Spanish American Ambulatory Disability Correlation Chart
The statistical analysis conducted on geographies consisting of 101,631,986 people shows no correlation between the proportion of Immigrants from Sierra Leone and percentage of population with ambulatory disability in the United States with a correlation coefficient (R) of 0.033 and weighted average of 5.8%. Similarly, the statistical analysis conducted on geographies consisting of 103,166,807 people shows a substantial positive correlation between the proportion of Spanish Americans and percentage of population with ambulatory disability in the United States with a correlation coefficient (R) of 0.548 and weighted average of 7.1%, a difference of 22.5%.
Ambulatory Disability Correlation Summary
| Measurement | Immigrants from Sierra Leone | Spanish American |
| Minimum | 2.2% | 2.1% |
| Maximum | 12.2% | 41.5% |
| Range | 10.0% | 39.4% |
| Mean | 5.8% | 10.5% |
| Median | 5.7% | 7.3% |
| Interquartile 25% (IQ1) | 4.8% | 6.1% |
| Interquartile 75% (IQ3) | 6.5% | 11.5% |
| Interquartile Range (IQR) | 1.7% | 5.4% |
| Standard Deviation (Sample) | 1.6% | 8.0% |
| Standard Deviation (Population) | 1.5% | 8.0% |
Similar Demographics by Ambulatory Disability
Demographics Similar to Immigrants from Sierra Leone by Ambulatory Disability
In terms of ambulatory disability, the demographic groups most similar to Immigrants from Sierra Leone are Immigrants from Denmark (5.8%, a difference of 0.010%), Bhutanese (5.8%, a difference of 0.17%), Australian (5.8%, a difference of 0.17%), Immigrants from Sudan (5.8%, a difference of 0.17%), and Kenyan (5.8%, a difference of 0.20%).
| Demographics | Rating | Rank | Ambulatory Disability |
| South Americans | 99.0 /100 | #85 | Exceptional 5.7% |
| Latvians | 99.0 /100 | #86 | Exceptional 5.7% |
| Immigrants | Chile | 98.9 /100 | #87 | Exceptional 5.8% |
| Soviet Union | 98.9 /100 | #88 | Exceptional 5.8% |
| Bhutanese | 98.8 /100 | #89 | Exceptional 5.8% |
| Australians | 98.8 /100 | #90 | Exceptional 5.8% |
| Immigrants | Sudan | 98.8 /100 | #91 | Exceptional 5.8% |
| Immigrants | Sierra Leone | 98.6 /100 | #92 | Exceptional 5.8% |
| Immigrants | Denmark | 98.6 /100 | #93 | Exceptional 5.8% |
| Kenyans | 98.4 /100 | #94 | Exceptional 5.8% |
| Immigrants | El Salvador | 98.4 /100 | #95 | Exceptional 5.8% |
| Salvadorans | 98.4 /100 | #96 | Exceptional 5.8% |
| Immigrants | Somalia | 98.3 /100 | #97 | Exceptional 5.8% |
| Immigrants | Lebanon | 98.3 /100 | #98 | Exceptional 5.8% |
| Immigrants | Northern Europe | 98.2 /100 | #99 | Exceptional 5.8% |
Demographics Similar to Spanish Americans by Ambulatory Disability
In terms of ambulatory disability, the demographic groups most similar to Spanish Americans are Chippewa (7.1%, a difference of 0.0%), Immigrants from the Azores (7.1%, a difference of 0.17%), Iroquois (7.1%, a difference of 0.26%), Arapaho (7.1%, a difference of 0.45%), and Cree (7.1%, a difference of 0.46%).
| Demographics | Rating | Rank | Ambulatory Disability |
| Marshallese | 0.0 /100 | #300 | Tragic 6.9% |
| British West Indians | 0.0 /100 | #301 | Tragic 7.0% |
| Immigrants | Armenia | 0.0 /100 | #302 | Tragic 7.0% |
| Africans | 0.0 /100 | #303 | Tragic 7.0% |
| Immigrants | Cabo Verde | 0.0 /100 | #304 | Tragic 7.0% |
| Immigrants | Micronesia | 0.0 /100 | #305 | Tragic 7.0% |
| Iroquois | 0.0 /100 | #306 | Tragic 7.1% |
| Spanish Americans | 0.0 /100 | #307 | Tragic 7.1% |
| Chippewa | 0.0 /100 | #308 | Tragic 7.1% |
| Immigrants | Azores | 0.0 /100 | #309 | Tragic 7.1% |
| Arapaho | 0.0 /100 | #310 | Tragic 7.1% |
| Cree | 0.0 /100 | #311 | Tragic 7.1% |
| Delaware | 0.0 /100 | #312 | Tragic 7.1% |
| Immigrants | Yemen | 0.0 /100 | #313 | Tragic 7.1% |
| Blackfeet | 0.0 /100 | #314 | Tragic 7.1% |