Immigrants from Sierra Leone vs Assyrian/Chaldean/Syriac Ambulatory Disability
COMPARE
Immigrants from Sierra Leone
Assyrian/Chaldean/Syriac
Ambulatory Disability
Ambulatory Disability Comparison
Immigrants from Sierra Leone
Assyrians/Chaldeans/Syriacs
5.8%
AMBULATORY DISABILITY
98.6/ 100
METRIC RATING
92nd/ 347
METRIC RANK
6.4%
AMBULATORY DISABILITY
2.4/ 100
METRIC RATING
232nd/ 347
METRIC RANK
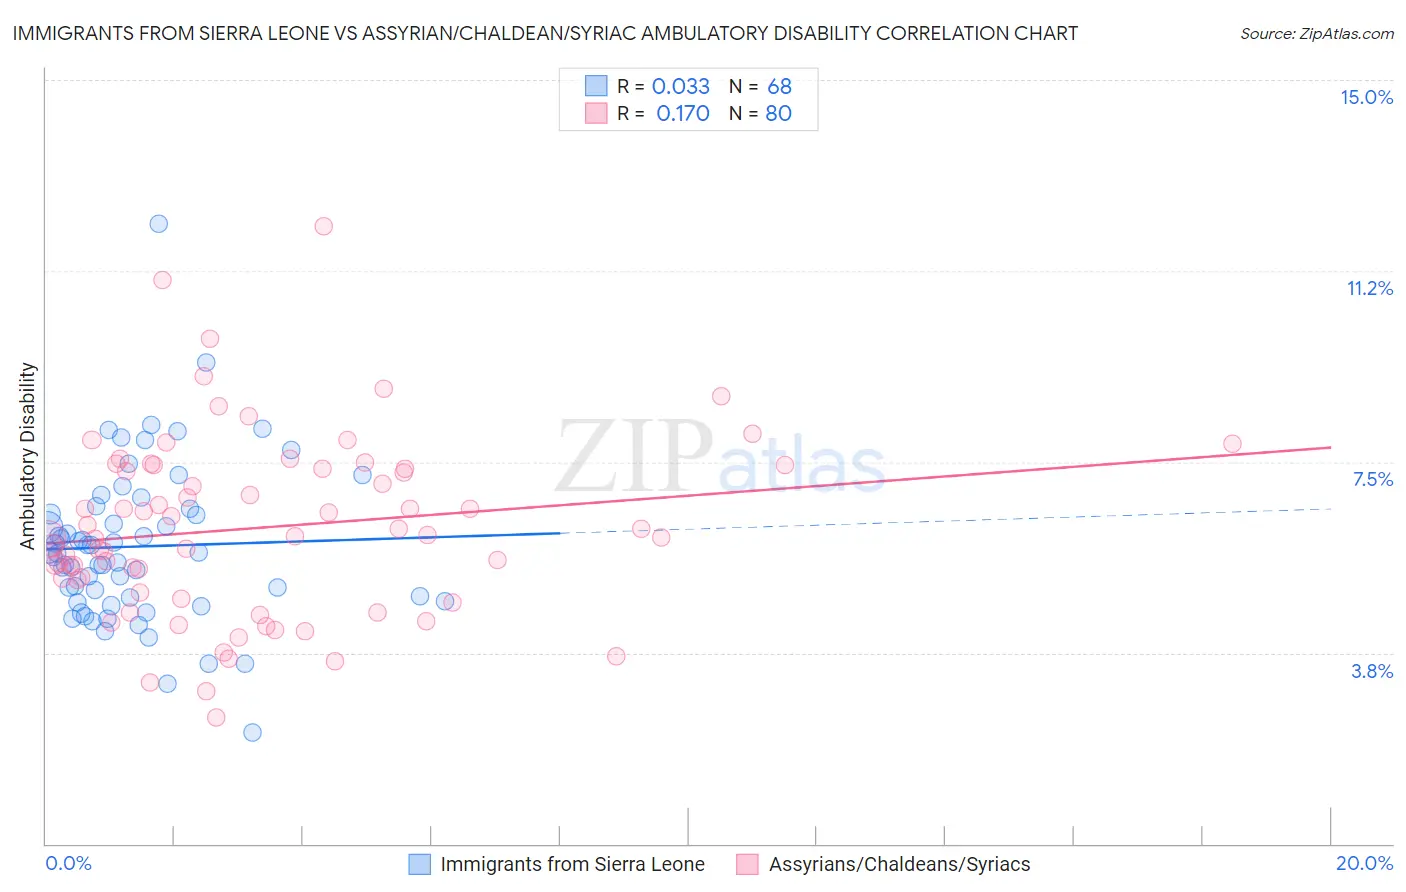
Immigrants from Sierra Leone vs Assyrian/Chaldean/Syriac Ambulatory Disability Correlation Chart
The statistical analysis conducted on geographies consisting of 101,631,986 people shows no correlation between the proportion of Immigrants from Sierra Leone and percentage of population with ambulatory disability in the United States with a correlation coefficient (R) of 0.033 and weighted average of 5.8%. Similarly, the statistical analysis conducted on geographies consisting of 110,309,207 people shows a poor positive correlation between the proportion of Assyrians/Chaldeans/Syriacs and percentage of population with ambulatory disability in the United States with a correlation coefficient (R) of 0.170 and weighted average of 6.4%, a difference of 11.2%.
Ambulatory Disability Correlation Summary
| Measurement | Immigrants from Sierra Leone | Assyrian/Chaldean/Syriac |
| Minimum | 2.2% | 2.5% |
| Maximum | 12.2% | 12.1% |
| Range | 10.0% | 9.7% |
| Mean | 5.8% | 6.2% |
| Median | 5.7% | 6.1% |
| Interquartile 25% (IQ1) | 4.8% | 5.1% |
| Interquartile 75% (IQ3) | 6.5% | 7.4% |
| Interquartile Range (IQR) | 1.7% | 2.3% |
| Standard Deviation (Sample) | 1.6% | 1.8% |
| Standard Deviation (Population) | 1.5% | 1.8% |
Similar Demographics by Ambulatory Disability
Demographics Similar to Immigrants from Sierra Leone by Ambulatory Disability
In terms of ambulatory disability, the demographic groups most similar to Immigrants from Sierra Leone are Immigrants from Denmark (5.8%, a difference of 0.010%), Bhutanese (5.8%, a difference of 0.17%), Australian (5.8%, a difference of 0.17%), Immigrants from Sudan (5.8%, a difference of 0.17%), and Kenyan (5.8%, a difference of 0.20%).
| Demographics | Rating | Rank | Ambulatory Disability |
| South Americans | 99.0 /100 | #85 | Exceptional 5.7% |
| Latvians | 99.0 /100 | #86 | Exceptional 5.7% |
| Immigrants | Chile | 98.9 /100 | #87 | Exceptional 5.8% |
| Soviet Union | 98.9 /100 | #88 | Exceptional 5.8% |
| Bhutanese | 98.8 /100 | #89 | Exceptional 5.8% |
| Australians | 98.8 /100 | #90 | Exceptional 5.8% |
| Immigrants | Sudan | 98.8 /100 | #91 | Exceptional 5.8% |
| Immigrants | Sierra Leone | 98.6 /100 | #92 | Exceptional 5.8% |
| Immigrants | Denmark | 98.6 /100 | #93 | Exceptional 5.8% |
| Kenyans | 98.4 /100 | #94 | Exceptional 5.8% |
| Immigrants | El Salvador | 98.4 /100 | #95 | Exceptional 5.8% |
| Salvadorans | 98.4 /100 | #96 | Exceptional 5.8% |
| Immigrants | Somalia | 98.3 /100 | #97 | Exceptional 5.8% |
| Immigrants | Lebanon | 98.3 /100 | #98 | Exceptional 5.8% |
| Immigrants | Northern Europe | 98.2 /100 | #99 | Exceptional 5.8% |
Demographics Similar to Assyrians/Chaldeans/Syriacs by Ambulatory Disability
In terms of ambulatory disability, the demographic groups most similar to Assyrians/Chaldeans/Syriacs are Subsaharan African (6.4%, a difference of 0.060%), Immigrants from Liberia (6.4%, a difference of 0.090%), Hispanic or Latino (6.4%, a difference of 0.12%), Dutch (6.4%, a difference of 0.27%), and Panamanian (6.4%, a difference of 0.33%).
| Demographics | Rating | Rank | Ambulatory Disability |
| Hondurans | 6.3 /100 | #225 | Tragic 6.3% |
| Slavs | 5.1 /100 | #226 | Tragic 6.4% |
| Cubans | 4.0 /100 | #227 | Tragic 6.4% |
| Portuguese | 4.0 /100 | #228 | Tragic 6.4% |
| Czechoslovakians | 3.8 /100 | #229 | Tragic 6.4% |
| Mexicans | 3.5 /100 | #230 | Tragic 6.4% |
| Panamanians | 3.1 /100 | #231 | Tragic 6.4% |
| Assyrians/Chaldeans/Syriacs | 2.4 /100 | #232 | Tragic 6.4% |
| Sub-Saharan Africans | 2.3 /100 | #233 | Tragic 6.4% |
| Immigrants | Liberia | 2.3 /100 | #234 | Tragic 6.4% |
| Hispanics or Latinos | 2.2 /100 | #235 | Tragic 6.4% |
| Dutch | 2.0 /100 | #236 | Tragic 6.4% |
| Immigrants | Germany | 1.8 /100 | #237 | Tragic 6.4% |
| Haitians | 1.8 /100 | #238 | Tragic 6.4% |
| Senegalese | 1.7 /100 | #239 | Tragic 6.4% |