Immigrants from Serbia vs Peruvian Disability
COMPARE
Immigrants from Serbia
Peruvian
Disability
Disability Comparison
Immigrants from Serbia
Peruvians
11.0%
DISABILITY
99.4/ 100
METRIC RATING
74th/ 347
METRIC RANK
10.9%
DISABILITY
99.8/ 100
METRIC RATING
51st/ 347
METRIC RANK
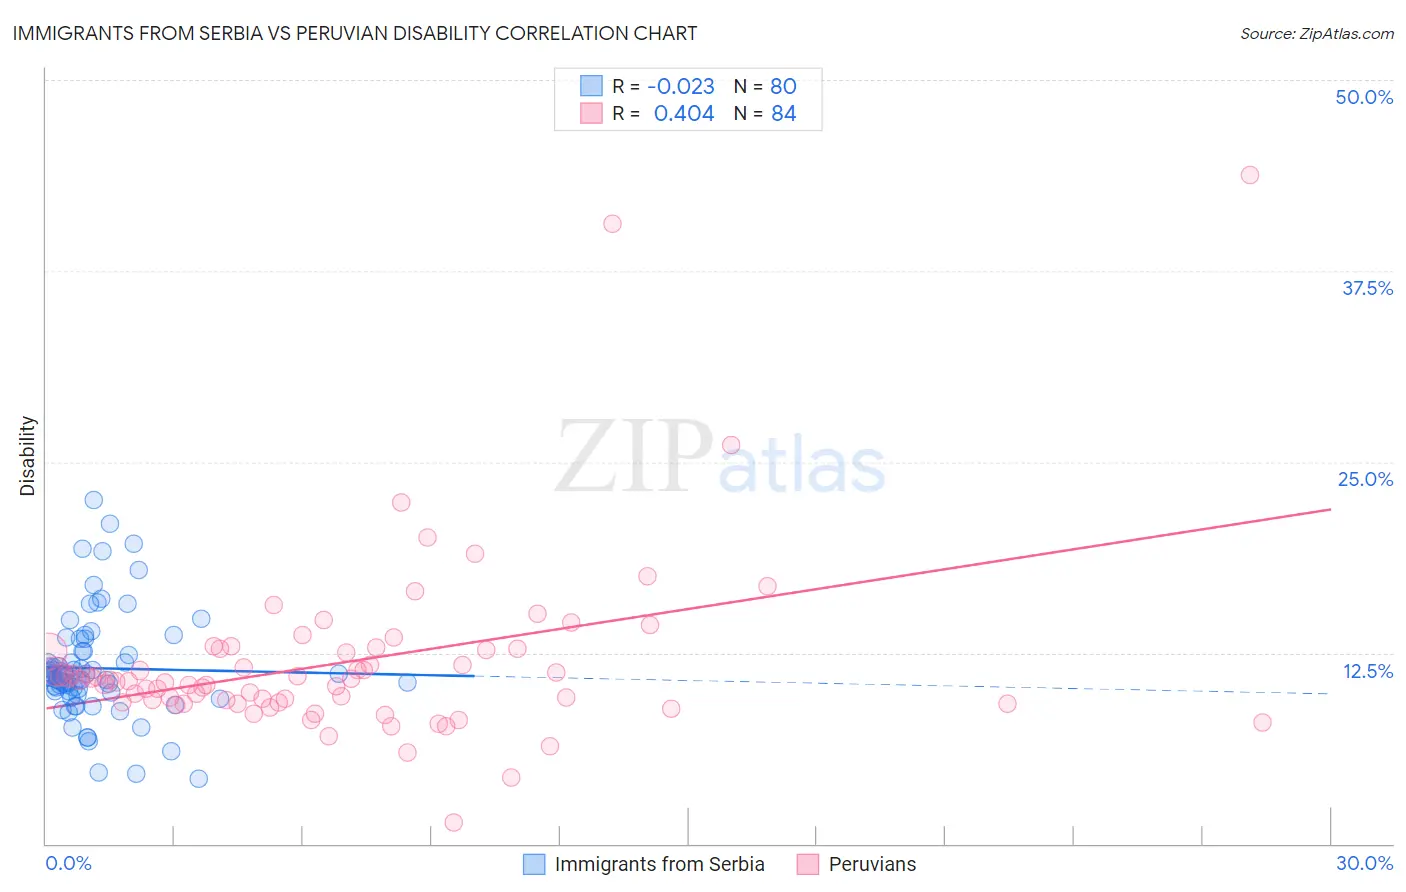
Immigrants from Serbia vs Peruvian Disability Correlation Chart
The statistical analysis conducted on geographies consisting of 131,748,462 people shows no correlation between the proportion of Immigrants from Serbia and percentage of population with a disability in the United States with a correlation coefficient (R) of -0.023 and weighted average of 11.0%. Similarly, the statistical analysis conducted on geographies consisting of 363,197,931 people shows a moderate positive correlation between the proportion of Peruvians and percentage of population with a disability in the United States with a correlation coefficient (R) of 0.404 and weighted average of 10.9%, a difference of 1.7%.
Disability Correlation Summary
| Measurement | Immigrants from Serbia | Peruvian |
| Minimum | 4.2% | 1.4% |
| Maximum | 22.5% | 43.8% |
| Range | 18.3% | 42.4% |
| Mean | 11.5% | 11.9% |
| Median | 11.0% | 10.7% |
| Interquartile 25% (IQ1) | 10.0% | 9.2% |
| Interquartile 75% (IQ3) | 12.6% | 12.7% |
| Interquartile Range (IQR) | 2.6% | 3.5% |
| Standard Deviation (Sample) | 3.5% | 6.0% |
| Standard Deviation (Population) | 3.4% | 5.9% |
Similar Demographics by Disability
Demographics Similar to Immigrants from Serbia by Disability
In terms of disability, the demographic groups most similar to Immigrants from Serbia are Immigrants from Bangladesh (11.0%, a difference of 0.020%), Immigrants from Vietnam (11.0%, a difference of 0.020%), Immigrants from Chile (11.0%, a difference of 0.040%), Sierra Leonean (11.0%, a difference of 0.050%), and Immigrants from Belgium (11.0%, a difference of 0.050%).
| Demographics | Rating | Rank | Disability |
| Colombians | 99.6 /100 | #67 | Exceptional 11.0% |
| Immigrants | Afghanistan | 99.6 /100 | #68 | Exceptional 11.0% |
| Sri Lankans | 99.5 /100 | #69 | Exceptional 11.0% |
| Immigrants | France | 99.4 /100 | #70 | Exceptional 11.0% |
| Immigrants | Lebanon | 99.4 /100 | #71 | Exceptional 11.0% |
| Immigrants | Chile | 99.4 /100 | #72 | Exceptional 11.0% |
| Immigrants | Bangladesh | 99.4 /100 | #73 | Exceptional 11.0% |
| Immigrants | Serbia | 99.4 /100 | #74 | Exceptional 11.0% |
| Immigrants | Vietnam | 99.4 /100 | #75 | Exceptional 11.0% |
| Sierra Leoneans | 99.3 /100 | #76 | Exceptional 11.0% |
| Immigrants | Belgium | 99.3 /100 | #77 | Exceptional 11.0% |
| Immigrants | Cameroon | 99.3 /100 | #78 | Exceptional 11.1% |
| Immigrants | Jordan | 99.3 /100 | #79 | Exceptional 11.1% |
| Immigrants | Ireland | 99.3 /100 | #80 | Exceptional 11.1% |
| Immigrants | Poland | 99.1 /100 | #81 | Exceptional 11.1% |
Demographics Similar to Peruvians by Disability
In terms of disability, the demographic groups most similar to Peruvians are Vietnamese (10.9%, a difference of 0.010%), Immigrants from Saudi Arabia (10.9%, a difference of 0.010%), South American (10.9%, a difference of 0.060%), Soviet Union (10.9%, a difference of 0.070%), and Immigrants from Spain (10.9%, a difference of 0.080%).
| Demographics | Rating | Rank | Disability |
| Immigrants | Japan | 99.9 /100 | #44 | Exceptional 10.8% |
| Immigrants | Peru | 99.9 /100 | #45 | Exceptional 10.8% |
| Tongans | 99.9 /100 | #46 | Exceptional 10.8% |
| Taiwanese | 99.9 /100 | #47 | Exceptional 10.8% |
| Soviet Union | 99.9 /100 | #48 | Exceptional 10.9% |
| Vietnamese | 99.9 /100 | #49 | Exceptional 10.9% |
| Immigrants | Saudi Arabia | 99.9 /100 | #50 | Exceptional 10.9% |
| Peruvians | 99.8 /100 | #51 | Exceptional 10.9% |
| South Americans | 99.8 /100 | #52 | Exceptional 10.9% |
| Immigrants | Spain | 99.8 /100 | #53 | Exceptional 10.9% |
| Jordanians | 99.8 /100 | #54 | Exceptional 10.9% |
| Immigrants | El Salvador | 99.8 /100 | #55 | Exceptional 10.9% |
| Immigrants | Lithuania | 99.8 /100 | #56 | Exceptional 10.9% |
| Salvadorans | 99.8 /100 | #57 | Exceptional 10.9% |
| Immigrants | South America | 99.8 /100 | #58 | Exceptional 10.9% |