Immigrants from Serbia vs Immigrants from Senegal Disability
COMPARE
Immigrants from Serbia
Immigrants from Senegal
Disability
Disability Comparison
Immigrants from Serbia
Immigrants from Senegal
11.0%
DISABILITY
99.4/ 100
METRIC RATING
74th/ 347
METRIC RANK
12.0%
DISABILITY
9.4/ 100
METRIC RATING
206th/ 347
METRIC RANK
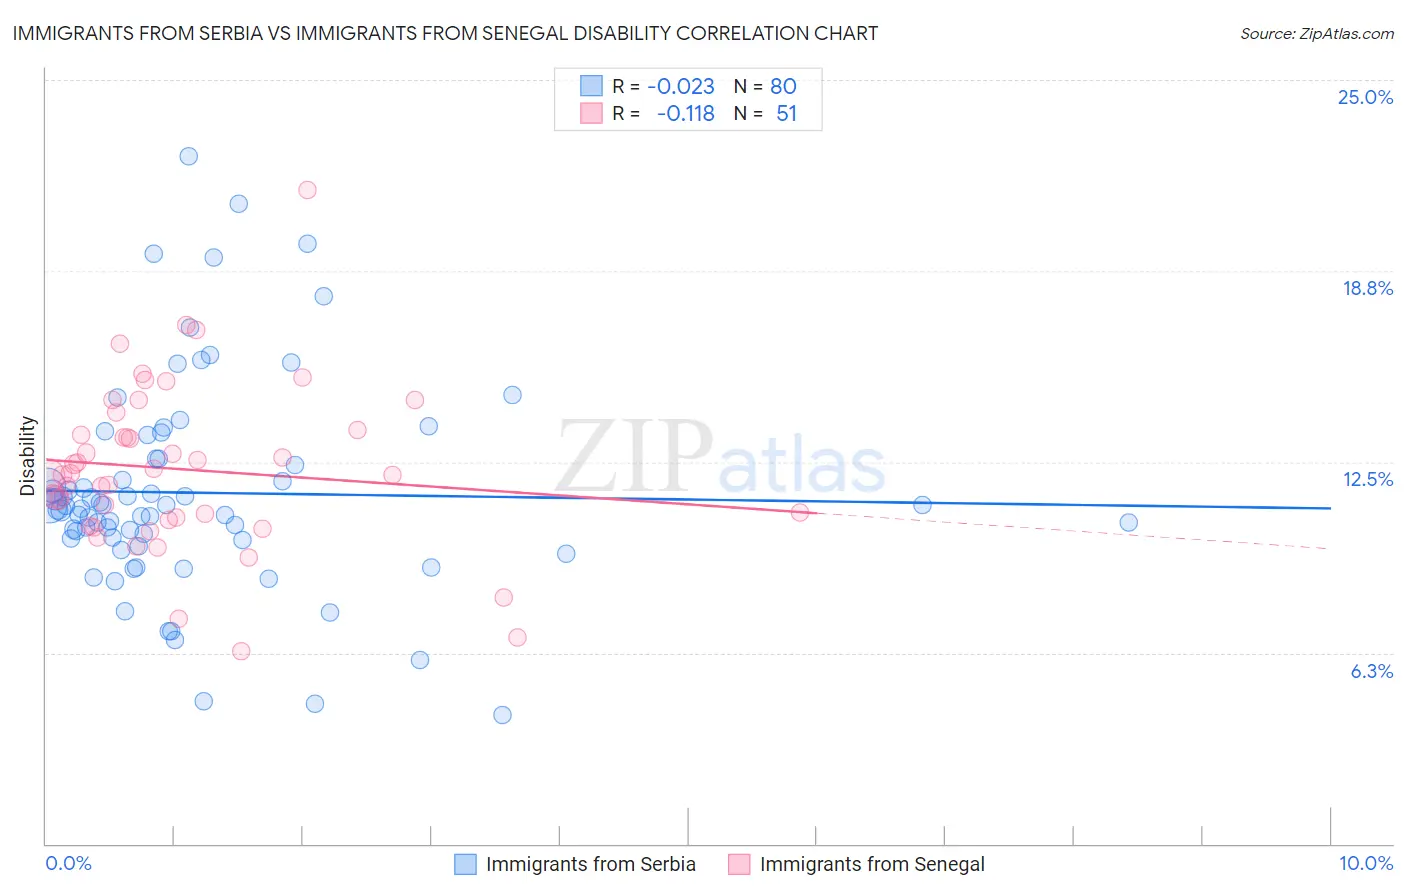
Immigrants from Serbia vs Immigrants from Senegal Disability Correlation Chart
The statistical analysis conducted on geographies consisting of 131,748,462 people shows no correlation between the proportion of Immigrants from Serbia and percentage of population with a disability in the United States with a correlation coefficient (R) of -0.023 and weighted average of 11.0%. Similarly, the statistical analysis conducted on geographies consisting of 90,129,421 people shows a poor negative correlation between the proportion of Immigrants from Senegal and percentage of population with a disability in the United States with a correlation coefficient (R) of -0.118 and weighted average of 12.0%, a difference of 8.6%.
Disability Correlation Summary
| Measurement | Immigrants from Serbia | Immigrants from Senegal |
| Minimum | 4.2% | 6.3% |
| Maximum | 22.5% | 21.4% |
| Range | 18.3% | 15.1% |
| Mean | 11.5% | 12.3% |
| Median | 11.0% | 12.1% |
| Interquartile 25% (IQ1) | 10.0% | 10.6% |
| Interquartile 75% (IQ3) | 12.6% | 13.6% |
| Interquartile Range (IQR) | 2.6% | 3.0% |
| Standard Deviation (Sample) | 3.5% | 2.7% |
| Standard Deviation (Population) | 3.4% | 2.7% |
Similar Demographics by Disability
Demographics Similar to Immigrants from Serbia by Disability
In terms of disability, the demographic groups most similar to Immigrants from Serbia are Immigrants from Bangladesh (11.0%, a difference of 0.020%), Immigrants from Vietnam (11.0%, a difference of 0.020%), Immigrants from Chile (11.0%, a difference of 0.040%), Sierra Leonean (11.0%, a difference of 0.050%), and Immigrants from Belgium (11.0%, a difference of 0.050%).
| Demographics | Rating | Rank | Disability |
| Colombians | 99.6 /100 | #67 | Exceptional 11.0% |
| Immigrants | Afghanistan | 99.6 /100 | #68 | Exceptional 11.0% |
| Sri Lankans | 99.5 /100 | #69 | Exceptional 11.0% |
| Immigrants | France | 99.4 /100 | #70 | Exceptional 11.0% |
| Immigrants | Lebanon | 99.4 /100 | #71 | Exceptional 11.0% |
| Immigrants | Chile | 99.4 /100 | #72 | Exceptional 11.0% |
| Immigrants | Bangladesh | 99.4 /100 | #73 | Exceptional 11.0% |
| Immigrants | Serbia | 99.4 /100 | #74 | Exceptional 11.0% |
| Immigrants | Vietnam | 99.4 /100 | #75 | Exceptional 11.0% |
| Sierra Leoneans | 99.3 /100 | #76 | Exceptional 11.0% |
| Immigrants | Belgium | 99.3 /100 | #77 | Exceptional 11.0% |
| Immigrants | Cameroon | 99.3 /100 | #78 | Exceptional 11.1% |
| Immigrants | Jordan | 99.3 /100 | #79 | Exceptional 11.1% |
| Immigrants | Ireland | 99.3 /100 | #80 | Exceptional 11.1% |
| Immigrants | Poland | 99.1 /100 | #81 | Exceptional 11.1% |
Demographics Similar to Immigrants from Senegal by Disability
In terms of disability, the demographic groups most similar to Immigrants from Senegal are Immigrants from Thailand (12.0%, a difference of 0.010%), Immigrants from Caribbean (12.0%, a difference of 0.040%), Immigrants from Western Europe (12.0%, a difference of 0.080%), Danish (12.0%, a difference of 0.080%), and Czech (12.0%, a difference of 0.21%).
| Demographics | Rating | Rank | Disability |
| Immigrants | Panama | 14.6 /100 | #199 | Poor 11.9% |
| Belizeans | 12.8 /100 | #200 | Poor 11.9% |
| Assyrians/Chaldeans/Syriacs | 12.6 /100 | #201 | Poor 11.9% |
| Immigrants | England | 12.0 /100 | #202 | Poor 12.0% |
| British West Indians | 11.5 /100 | #203 | Poor 12.0% |
| Mexican American Indians | 11.4 /100 | #204 | Poor 12.0% |
| Immigrants | Western Europe | 10.1 /100 | #205 | Poor 12.0% |
| Immigrants | Senegal | 9.4 /100 | #206 | Tragic 12.0% |
| Immigrants | Thailand | 9.3 /100 | #207 | Tragic 12.0% |
| Immigrants | Caribbean | 9.1 /100 | #208 | Tragic 12.0% |
| Danes | 8.7 /100 | #209 | Tragic 12.0% |
| Czechs | 7.9 /100 | #210 | Tragic 12.0% |
| Immigrants | Cambodia | 7.3 /100 | #211 | Tragic 12.0% |
| Austrians | 7.2 /100 | #212 | Tragic 12.0% |
| Immigrants | Iraq | 7.1 /100 | #213 | Tragic 12.0% |