Immigrants from Serbia vs American Disability
COMPARE
Immigrants from Serbia
American
Disability
Disability Comparison
Immigrants from Serbia
Americans
11.0%
DISABILITY
99.4/ 100
METRIC RATING
74th/ 347
METRIC RANK
13.9%
DISABILITY
0.0/ 100
METRIC RATING
322nd/ 347
METRIC RANK
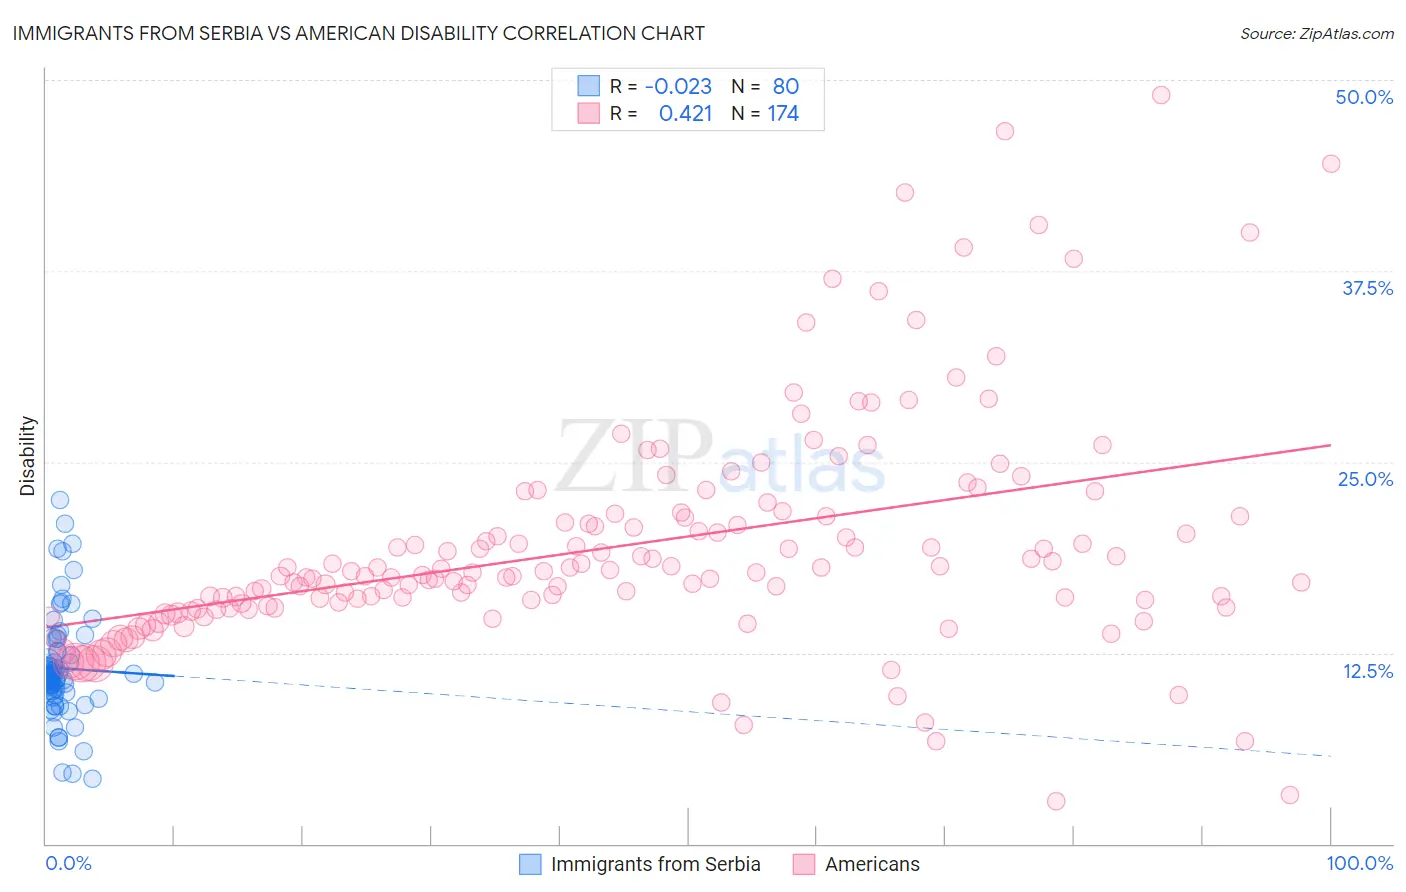
Immigrants from Serbia vs American Disability Correlation Chart
The statistical analysis conducted on geographies consisting of 131,748,462 people shows no correlation between the proportion of Immigrants from Serbia and percentage of population with a disability in the United States with a correlation coefficient (R) of -0.023 and weighted average of 11.0%. Similarly, the statistical analysis conducted on geographies consisting of 581,794,262 people shows a moderate positive correlation between the proportion of Americans and percentage of population with a disability in the United States with a correlation coefficient (R) of 0.421 and weighted average of 13.9%, a difference of 26.1%.
Disability Correlation Summary
| Measurement | Immigrants from Serbia | American |
| Minimum | 4.2% | 2.8% |
| Maximum | 22.5% | 49.1% |
| Range | 18.3% | 46.3% |
| Mean | 11.5% | 19.4% |
| Median | 11.0% | 17.7% |
| Interquartile 25% (IQ1) | 10.0% | 15.4% |
| Interquartile 75% (IQ3) | 12.6% | 21.4% |
| Interquartile Range (IQR) | 2.6% | 6.0% |
| Standard Deviation (Sample) | 3.5% | 7.5% |
| Standard Deviation (Population) | 3.4% | 7.5% |
Similar Demographics by Disability
Demographics Similar to Immigrants from Serbia by Disability
In terms of disability, the demographic groups most similar to Immigrants from Serbia are Immigrants from Bangladesh (11.0%, a difference of 0.020%), Immigrants from Vietnam (11.0%, a difference of 0.020%), Immigrants from Chile (11.0%, a difference of 0.040%), Sierra Leonean (11.0%, a difference of 0.050%), and Immigrants from Belgium (11.0%, a difference of 0.050%).
| Demographics | Rating | Rank | Disability |
| Colombians | 99.6 /100 | #67 | Exceptional 11.0% |
| Immigrants | Afghanistan | 99.6 /100 | #68 | Exceptional 11.0% |
| Sri Lankans | 99.5 /100 | #69 | Exceptional 11.0% |
| Immigrants | France | 99.4 /100 | #70 | Exceptional 11.0% |
| Immigrants | Lebanon | 99.4 /100 | #71 | Exceptional 11.0% |
| Immigrants | Chile | 99.4 /100 | #72 | Exceptional 11.0% |
| Immigrants | Bangladesh | 99.4 /100 | #73 | Exceptional 11.0% |
| Immigrants | Serbia | 99.4 /100 | #74 | Exceptional 11.0% |
| Immigrants | Vietnam | 99.4 /100 | #75 | Exceptional 11.0% |
| Sierra Leoneans | 99.3 /100 | #76 | Exceptional 11.0% |
| Immigrants | Belgium | 99.3 /100 | #77 | Exceptional 11.0% |
| Immigrants | Cameroon | 99.3 /100 | #78 | Exceptional 11.1% |
| Immigrants | Jordan | 99.3 /100 | #79 | Exceptional 11.1% |
| Immigrants | Ireland | 99.3 /100 | #80 | Exceptional 11.1% |
| Immigrants | Poland | 99.1 /100 | #81 | Exceptional 11.1% |
Demographics Similar to Americans by Disability
In terms of disability, the demographic groups most similar to Americans are Paiute (13.9%, a difference of 0.42%), Apache (13.9%, a difference of 0.55%), Iroquois (13.8%, a difference of 0.84%), Menominee (13.8%, a difference of 1.1%), and Comanche (14.1%, a difference of 1.3%).
| Demographics | Rating | Rank | Disability |
| Puget Sound Salish | 0.0 /100 | #315 | Tragic 13.7% |
| Pima | 0.0 /100 | #316 | Tragic 13.7% |
| Immigrants | Cabo Verde | 0.0 /100 | #317 | Tragic 13.7% |
| Menominee | 0.0 /100 | #318 | Tragic 13.8% |
| Iroquois | 0.0 /100 | #319 | Tragic 13.8% |
| Apache | 0.0 /100 | #320 | Tragic 13.9% |
| Paiute | 0.0 /100 | #321 | Tragic 13.9% |
| Americans | 0.0 /100 | #322 | Tragic 13.9% |
| Comanche | 0.0 /100 | #323 | Tragic 14.1% |
| Chippewa | 0.0 /100 | #324 | Tragic 14.1% |
| Natives/Alaskans | 0.0 /100 | #325 | Tragic 14.2% |
| Osage | 0.0 /100 | #326 | Tragic 14.2% |
| Ottawa | 0.0 /100 | #327 | Tragic 14.2% |
| Immigrants | Azores | 0.0 /100 | #328 | Tragic 14.2% |
| Potawatomi | 0.0 /100 | #329 | Tragic 14.2% |