Danish vs Peruvian Disability
COMPARE
Danish
Peruvian
Disability
Disability Comparison
Danes
Peruvians
12.0%
DISABILITY
8.7/ 100
METRIC RATING
209th/ 347
METRIC RANK
10.9%
DISABILITY
99.8/ 100
METRIC RATING
51st/ 347
METRIC RANK
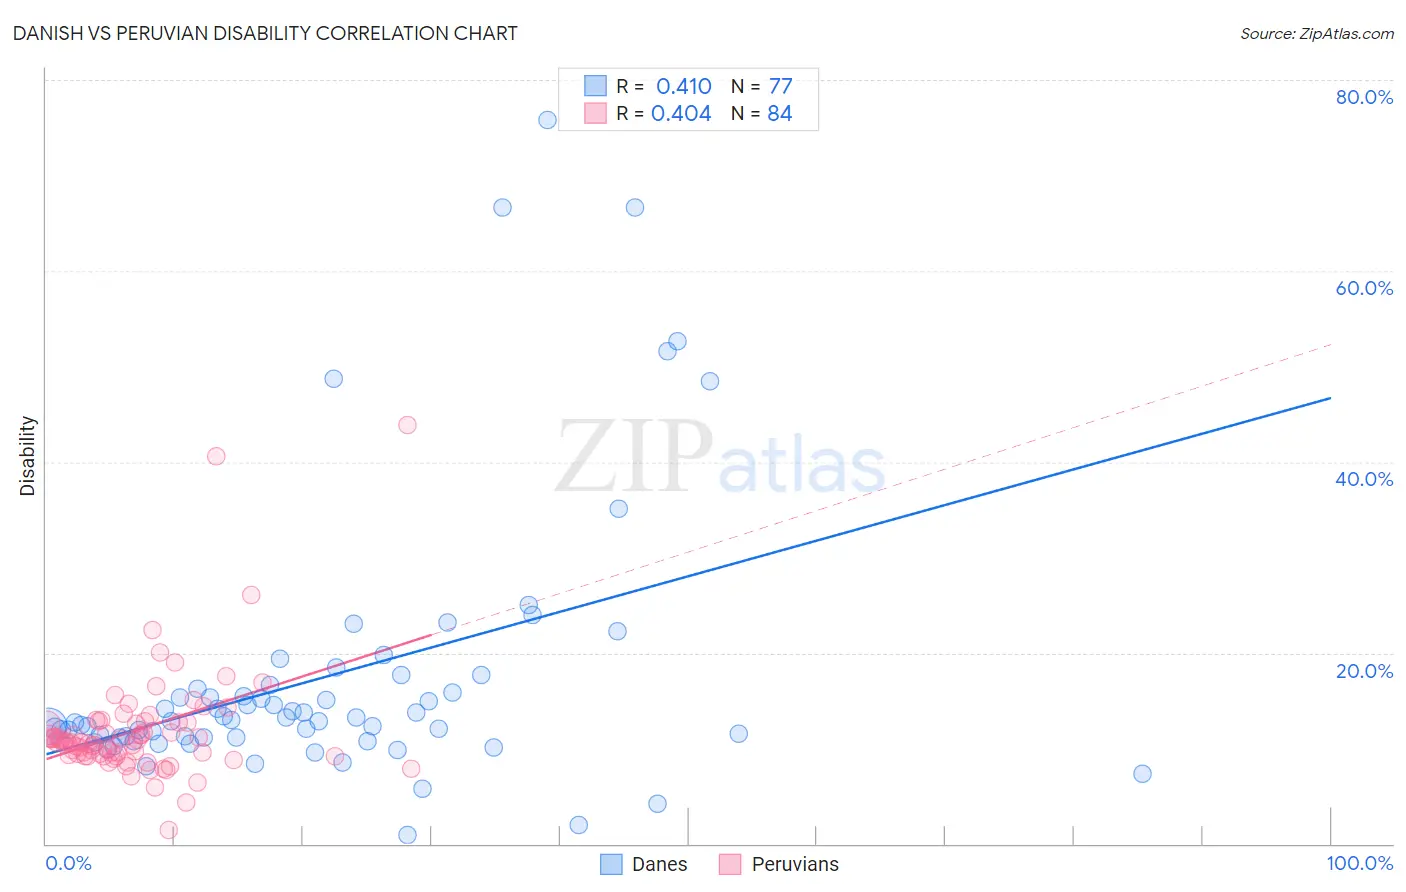
Danish vs Peruvian Disability Correlation Chart
The statistical analysis conducted on geographies consisting of 474,128,503 people shows a moderate positive correlation between the proportion of Danes and percentage of population with a disability in the United States with a correlation coefficient (R) of 0.410 and weighted average of 12.0%. Similarly, the statistical analysis conducted on geographies consisting of 363,197,931 people shows a moderate positive correlation between the proportion of Peruvians and percentage of population with a disability in the United States with a correlation coefficient (R) of 0.404 and weighted average of 10.9%, a difference of 10.5%.
Disability Correlation Summary
| Measurement | Danish | Peruvian |
| Minimum | 0.97% | 1.4% |
| Maximum | 75.8% | 43.8% |
| Range | 74.8% | 42.4% |
| Mean | 17.5% | 11.9% |
| Median | 12.9% | 10.7% |
| Interquartile 25% (IQ1) | 11.1% | 9.2% |
| Interquartile 75% (IQ3) | 16.5% | 12.7% |
| Interquartile Range (IQR) | 5.4% | 3.5% |
| Standard Deviation (Sample) | 14.3% | 6.0% |
| Standard Deviation (Population) | 14.2% | 5.9% |
Similar Demographics by Disability
Demographics Similar to Danes by Disability
In terms of disability, the demographic groups most similar to Danes are Immigrants from Caribbean (12.0%, a difference of 0.050%), Immigrants from Thailand (12.0%, a difference of 0.070%), Immigrants from Senegal (12.0%, a difference of 0.080%), Czech (12.0%, a difference of 0.13%), and Immigrants from Western Europe (12.0%, a difference of 0.17%).
| Demographics | Rating | Rank | Disability |
| Immigrants | England | 12.0 /100 | #202 | Poor 12.0% |
| British West Indians | 11.5 /100 | #203 | Poor 12.0% |
| Mexican American Indians | 11.4 /100 | #204 | Poor 12.0% |
| Immigrants | Western Europe | 10.1 /100 | #205 | Poor 12.0% |
| Immigrants | Senegal | 9.4 /100 | #206 | Tragic 12.0% |
| Immigrants | Thailand | 9.3 /100 | #207 | Tragic 12.0% |
| Immigrants | Caribbean | 9.1 /100 | #208 | Tragic 12.0% |
| Danes | 8.7 /100 | #209 | Tragic 12.0% |
| Czechs | 7.9 /100 | #210 | Tragic 12.0% |
| Immigrants | Cambodia | 7.3 /100 | #211 | Tragic 12.0% |
| Austrians | 7.2 /100 | #212 | Tragic 12.0% |
| Immigrants | Iraq | 7.1 /100 | #213 | Tragic 12.0% |
| Immigrants | Somalia | 6.8 /100 | #214 | Tragic 12.0% |
| Immigrants | Canada | 6.1 /100 | #215 | Tragic 12.1% |
| Panamanians | 5.4 /100 | #216 | Tragic 12.1% |
Demographics Similar to Peruvians by Disability
In terms of disability, the demographic groups most similar to Peruvians are Vietnamese (10.9%, a difference of 0.010%), Immigrants from Saudi Arabia (10.9%, a difference of 0.010%), South American (10.9%, a difference of 0.060%), Soviet Union (10.9%, a difference of 0.070%), and Immigrants from Spain (10.9%, a difference of 0.080%).
| Demographics | Rating | Rank | Disability |
| Immigrants | Japan | 99.9 /100 | #44 | Exceptional 10.8% |
| Immigrants | Peru | 99.9 /100 | #45 | Exceptional 10.8% |
| Tongans | 99.9 /100 | #46 | Exceptional 10.8% |
| Taiwanese | 99.9 /100 | #47 | Exceptional 10.8% |
| Soviet Union | 99.9 /100 | #48 | Exceptional 10.9% |
| Vietnamese | 99.9 /100 | #49 | Exceptional 10.9% |
| Immigrants | Saudi Arabia | 99.9 /100 | #50 | Exceptional 10.9% |
| Peruvians | 99.8 /100 | #51 | Exceptional 10.9% |
| South Americans | 99.8 /100 | #52 | Exceptional 10.9% |
| Immigrants | Spain | 99.8 /100 | #53 | Exceptional 10.9% |
| Jordanians | 99.8 /100 | #54 | Exceptional 10.9% |
| Immigrants | El Salvador | 99.8 /100 | #55 | Exceptional 10.9% |
| Immigrants | Lithuania | 99.8 /100 | #56 | Exceptional 10.9% |
| Salvadorans | 99.8 /100 | #57 | Exceptional 10.9% |
| Immigrants | South America | 99.8 /100 | #58 | Exceptional 10.9% |