Immigrants from Germany vs Immigrants from Morocco Self-Care Disability
COMPARE
Immigrants from Germany
Immigrants from Morocco
Self-Care Disability
Self-Care Disability Comparison
Immigrants from Germany
Immigrants from Morocco
2.5%
SELF-CARE DISABILITY
17.9/ 100
METRIC RATING
194th/ 347
METRIC RANK
2.4%
SELF-CARE DISABILITY
90.2/ 100
METRIC RATING
124th/ 347
METRIC RANK
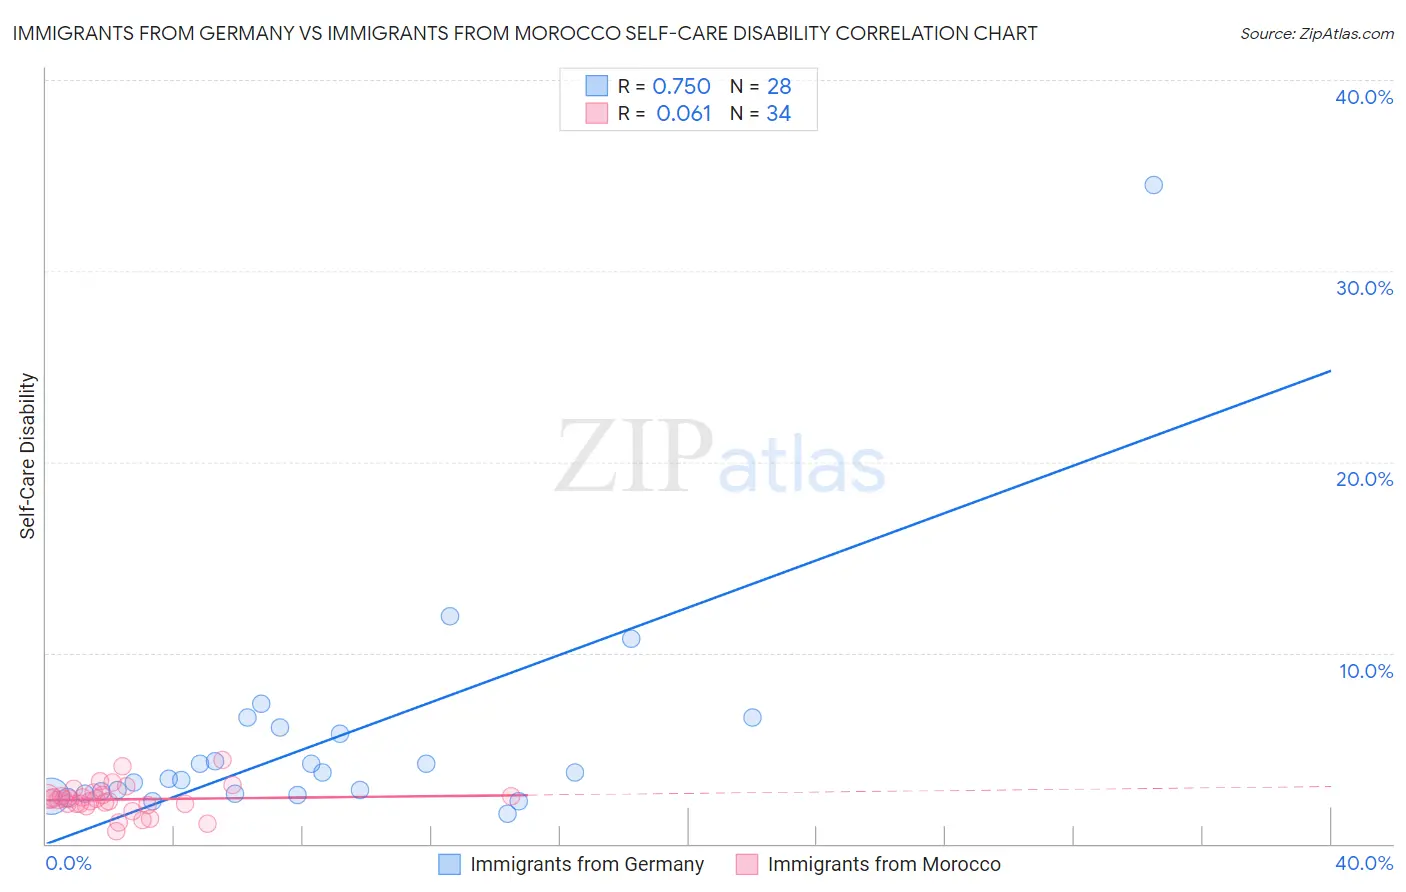
Immigrants from Germany vs Immigrants from Morocco Self-Care Disability Correlation Chart
The statistical analysis conducted on geographies consisting of 463,338,664 people shows a strong positive correlation between the proportion of Immigrants from Germany and percentage of population with self-care disability in the United States with a correlation coefficient (R) of 0.750 and weighted average of 2.5%. Similarly, the statistical analysis conducted on geographies consisting of 178,885,702 people shows a slight positive correlation between the proportion of Immigrants from Morocco and percentage of population with self-care disability in the United States with a correlation coefficient (R) of 0.061 and weighted average of 2.4%, a difference of 4.6%.
Self-Care Disability Correlation Summary
| Measurement | Immigrants from Germany | Immigrants from Morocco |
| Minimum | 1.6% | 0.66% |
| Maximum | 34.5% | 4.4% |
| Range | 32.9% | 3.7% |
| Mean | 5.4% | 2.3% |
| Median | 3.6% | 2.3% |
| Interquartile 25% (IQ1) | 2.6% | 2.1% |
| Interquartile 75% (IQ3) | 5.9% | 2.6% |
| Interquartile Range (IQR) | 3.3% | 0.52% |
| Standard Deviation (Sample) | 6.2% | 0.77% |
| Standard Deviation (Population) | 6.1% | 0.76% |
Similar Demographics by Self-Care Disability
Demographics Similar to Immigrants from Germany by Self-Care Disability
In terms of self-care disability, the demographic groups most similar to Immigrants from Germany are Immigrants from Southern Europe (2.5%, a difference of 0.19%), Korean (2.5%, a difference of 0.20%), Crow (2.5%, a difference of 0.23%), Immigrants (2.5%, a difference of 0.25%), and Ukrainian (2.5%, a difference of 0.26%).
| Demographics | Rating | Rank | Self-Care Disability |
| Irish | 28.7 /100 | #187 | Fair 2.5% |
| Immigrants | Oceania | 28.3 /100 | #188 | Fair 2.5% |
| Immigrants | Eastern Europe | 28.0 /100 | #189 | Fair 2.5% |
| Sioux | 24.6 /100 | #190 | Fair 2.5% |
| Moroccans | 22.9 /100 | #191 | Fair 2.5% |
| Soviet Union | 22.2 /100 | #192 | Fair 2.5% |
| Ukrainians | 21.4 /100 | #193 | Fair 2.5% |
| Immigrants | Germany | 17.9 /100 | #194 | Poor 2.5% |
| Immigrants | Southern Europe | 15.6 /100 | #195 | Poor 2.5% |
| Koreans | 15.5 /100 | #196 | Poor 2.5% |
| Crow | 15.2 /100 | #197 | Poor 2.5% |
| Immigrants | Immigrants | 15.0 /100 | #198 | Poor 2.5% |
| Immigrants | Ghana | 14.7 /100 | #199 | Poor 2.5% |
| Immigrants | Western Africa | 13.3 /100 | #200 | Poor 2.5% |
| Immigrants | South Eastern Asia | 12.9 /100 | #201 | Poor 2.5% |
Demographics Similar to Immigrants from Morocco by Self-Care Disability
In terms of self-care disability, the demographic groups most similar to Immigrants from Morocco are Immigrants from North America (2.4%, a difference of 0.0%), Immigrants from Nigeria (2.4%, a difference of 0.010%), Hmong (2.4%, a difference of 0.040%), Colombian (2.4%, a difference of 0.070%), and Immigrants from Hungary (2.4%, a difference of 0.080%).
| Demographics | Rating | Rank | Self-Care Disability |
| Taiwanese | 92.5 /100 | #117 | Exceptional 2.4% |
| Immigrants | Canada | 92.0 /100 | #118 | Exceptional 2.4% |
| Immigrants | Sierra Leone | 91.8 /100 | #119 | Exceptional 2.4% |
| Uruguayans | 91.5 /100 | #120 | Exceptional 2.4% |
| Peruvians | 91.3 /100 | #121 | Exceptional 2.4% |
| Belgians | 90.9 /100 | #122 | Exceptional 2.4% |
| Immigrants | Nigeria | 90.3 /100 | #123 | Exceptional 2.4% |
| Immigrants | North America | 90.2 /100 | #124 | Exceptional 2.4% |
| Immigrants | Morocco | 90.2 /100 | #124 | Exceptional 2.4% |
| Hmong | 89.9 /100 | #126 | Excellent 2.4% |
| Colombians | 89.7 /100 | #127 | Excellent 2.4% |
| Immigrants | Hungary | 89.6 /100 | #128 | Excellent 2.4% |
| Immigrants | Romania | 89.3 /100 | #129 | Excellent 2.4% |
| Immigrants | Austria | 89.0 /100 | #130 | Excellent 2.4% |
| Poles | 88.9 /100 | #131 | Excellent 2.4% |